


The regression is linear when the curve of the regression is __________.
$\left( {\text{A}} \right)$ Straight line
$\left( {\text{B}} \right)$ Not a straight line
$\left( {\text{C}} \right)$ Concave to the origin
$\left( {\text{D}} \right)$ Convex to the origin
Answer
622.5k+ views
Hint: Linear regression can be described as graphical representation with the relationship between a scalar response and variables. We can assume a graph showing the linear regression and we will conclude the solution.
Complete step-by-step solution:
To determine the relationship between a series of other variables and one dependent variable (can be denoted as Y) which are usually independent variables is the regression of the statistical method.
Let us start with an example,
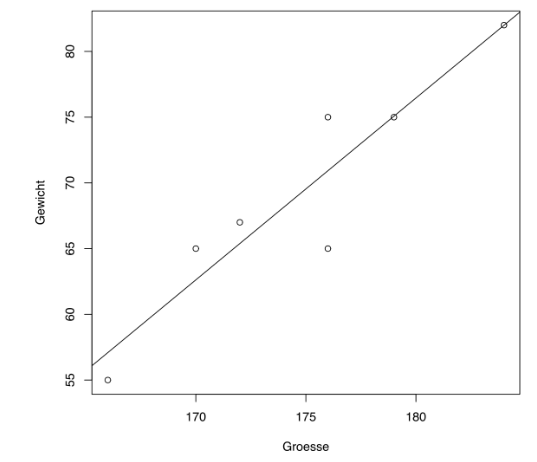
Look in the above figure; it is an example of linear regression.
Here, the given dependent variable (i.e) Y axis with the independent variables (i.e) X axis.
Similarly, when we consider an equation of linear regression and plot the graph, the result we always get is a straight line.
So, the curve of regression of a linear regression is a straight line.
Therefore, the correct answer is $\left( {\text{A}} \right)$.
Note: The regression is said to be linear if the curve of the regression is a straight line.
The graph and equation obtained from the linear regression tends to be similar to the equation of straight line.
Other conditions such as not a straight line, concave to the origin and convex to the origin are applied to the regression to be non-linear.
In a non-linear regression, it always results in the curve of the regression.
Complete step-by-step solution:
To determine the relationship between a series of other variables and one dependent variable (can be denoted as Y) which are usually independent variables is the regression of the statistical method.
Let us start with an example,
Look in the above figure; it is an example of linear regression.
Here, the given dependent variable (i.e) Y axis with the independent variables (i.e) X axis.
Similarly, when we consider an equation of linear regression and plot the graph, the result we always get is a straight line.
So, the curve of regression of a linear regression is a straight line.
Therefore, the correct answer is $\left( {\text{A}} \right)$.
Note: The regression is said to be linear if the curve of the regression is a straight line.
The graph and equation obtained from the linear regression tends to be similar to the equation of straight line.
Other conditions such as not a straight line, concave to the origin and convex to the origin are applied to the regression to be non-linear.
In a non-linear regression, it always results in the curve of the regression.
Recently Updated Pages
Basicity of sulphurous acid and sulphuric acid are
Master Class 11 English: Engaging Questions & Answers for Success
Master Class 11 Physics: Engaging Questions & Answers for Success
Master Class 11 Computer Science: Engaging Questions & Answers for Success
Master Class 11 Chemistry: Engaging Questions & Answers for Success
Master Class 11 Social Science: Engaging Questions & Answers for Success
Trending doubts
Difference Between Prokaryotic Cells and Eukaryotic Cells
Two of the body parts which do not appear in MRI are class 11 biology CBSE
One Metric ton is equal to kg A 10000 B 1000 C 100 class 11 physics CBSE
10 examples of friction in our daily life
Draw a diagram of nephron and explain its structur class 11 biology CBSE
What will happen if the mucus is not secreted by the class 11 biology CBSE