


The population growth depicted in the graph can be best described as
A. On day 1, the resources of the population limit its growth
B. On day 2, the birth rate per individual is greater than on day 1
C. On day 3, the population size is equal to K.
D. On day 4, the curve is most similar to an exponential growth curve.
E. On day 5, the number of deaths approaches the number of births.
Answer
619.5k+ views
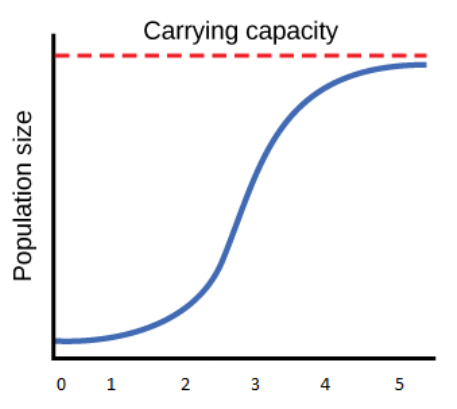
Hint: The given graph shows the population growth per given day for an organism. The graph shows the pattern of the growth of population at different time intervals if the population peaked out in the end. This population graph is studied for various stages of the population of an organism.
Complete answer: The above graph shows the trend of increase of population in a given day when the population of an individual suddenly grows from day 0 to 4. The population of an individual starts from the lag phase, which is the beginning of the growth of an individual. In this phase, an organism gets used to the environment and becomes ready for growth. Then there is a log phase in which the growth increases rapidly and the organism starts to grow exponentially. The last stage when the growth of an organism reaches its peak level on day 5, it is known as the stationary phase as the growth of an organism reaches an equilibrium that is birth of an organism becomes equal to the death of an organism. The population on day 5 remains constant and it can be described more accurately. There is a sudden rise in the growth of an individual on day 2 and then day 3 and 4, but the growth became constant after a certain level on day 5.
Hence, the correct option is E, i.e., On day 5, the number of deaths approaches the number of births.
Note: There are generally three phases in the growth of an individual organism. These phases are classified as lag phases where the individual becomes comfortable with the environment. Then comes the log of exponential phase when the growth is increased rapidly and reaches a peak level. Then there is the stationary phase in which growth remains constant.
Recently Updated Pages
Basicity of sulphurous acid and sulphuric acid are
Master Class 12 Economics: Engaging Questions & Answers for Success
Master Class 12 Biology: Engaging Questions & Answers for Success
Master Class 11 English: Engaging Questions & Answers for Success
Master Class 11 Physics: Engaging Questions & Answers for Success
Master Class 11 Computer Science: Engaging Questions & Answers for Success
Trending doubts
Draw a labelled sketch of the human eye class 12 physics CBSE
The chemical formula of tear gas is A CO Cl 2 B C 10 class 12 chemistry CBSE
Draw ray diagrams each showing i myopic eye and ii class 12 physics CBSE
Which are the Top 10 Largest Countries of the World?
Differentiate between homogeneous and heterogeneous class 12 chemistry CBSE
Which is the correct genotypic ratio of mendel dihybrid class 12 biology CBSE