


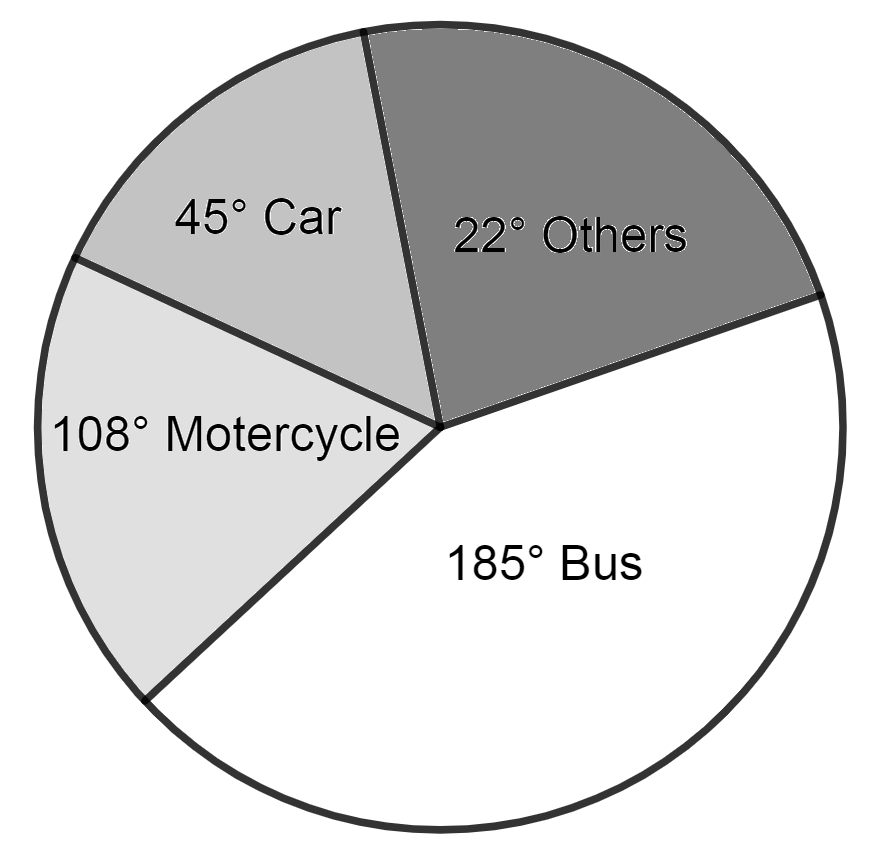
The pie chart shows four different modes of transport to school for a group of students. Calculate the percentage of students who go to school by bus.
A. 13.5%
B. 34.7%
C. 51.3%
D. 40.3%
Answer
633k+ views
Hint: Consider that total angle contained in a circle is \[{360^ \circ } \] and total percentage is 100%. So, the percent carried out by number of students traveling by bus can be calculated by finding value of \[\dfrac{{{{185}^ \circ }}}{{{{360}^ \circ }}} \times 100\% \]
Complete step-by-step answer:
In the question, we are given a pie chart which shows four different modes of transport to school for a group of students.
In a pie chart, the full circle is the total 100% of the data. The frequency count for each interval is then figured out as a percentage of the total. For example, in our test score data, the total number of students is 21 and the number of students between 70 and 80 is 7. So, the percent of circle of pie chart, the number of students between 70 and 80 hold is \[\dfrac{7}{{21}} \times 100\% \Rightarrow 33\dfrac{1}{3}\% \]
Now, we can convert the percent sign into degree by multiplying it with \[{360^ \circ } \]
Here, in the given pie chart the degree contained by the bus in the circle is \[{185^ \circ } \]
Now, as we know that, the total degree provided by the circle is \[{360^ \circ } \]. So, we can find the percentage of students who go by bus by calculating the value of \[\dfrac{{{{185}^ \circ }}}{{{{360}^ \circ }}} \times 100\% \] which is 51.3%.
Therefore, the correct option of the given question is C.
Note: A circle of the pie chart represents 100% of the data and also \[{360^ \circ } \] value. So, we can also say that in every 1% there is \[\dfrac{{360}}{{100}} \Rightarrow {36^ \circ } \] or in every \[{1^ \circ } \] there is \[\dfrac{{100}}{{360}} \Rightarrow \left( {\dfrac{5}{{18}}} \right)\% \]. So, for \[{185^ \circ } \]we can get the percentage as \[185 \times \left( {\dfrac{5}{{18}}} \right) = 51.3\% \].
Recently Updated Pages
Master Class 12 Economics: Engaging Questions & Answers for Success
Master Class 12 English: Engaging Questions & Answers for Success
Master Class 12 Social Science: Engaging Questions & Answers for Success
Master Class 12 Maths: Engaging Questions & Answers for Success
Master Class 12 Physics: Engaging Questions & Answers for Success
Master Class 9 General Knowledge: Engaging Questions & Answers for Success
Trending doubts
Explain the Treaty of Vienna of 1815 class 10 social science CBSE
Why is it 530 pm in india when it is 1200 afternoon class 10 social science CBSE
What is the full form of POSCO class 10 social science CBSE
Define Potential, Developed, Stock and Reserved resources
Which Country Has the Largest Border with India?
Complete the sentence with the most appropriate word class 10 english CBSE