


The picture is an example of__________.
A. Data analysis
B. Statistics
C. Mensuration
D. Data handling
Answer
589.8k+ views
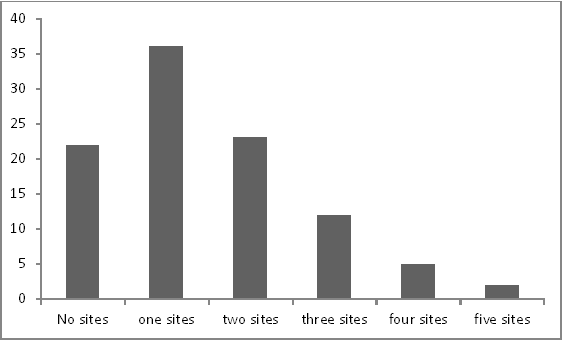
Hint: Here we have to identify the given picture. Also, we have to choose a correct option from the given options by using the properties. It is a bar diagram that represents the set of values.
Formula used: Some of the properties of the bar diagram is
All the bars have equal width.
The heights of all the bars indicated the frequency which means that the frequency is plotted on the y axis.
All bars are equally situated from each other.
Complete step by step solution:
Here, the given picture is of a bar diagram. The x axis represents the variables that are the number of sites here. The y axis is the frequency. The height of each bar represents the frequency.
According to the options,
Option A is Data analysis. Data analysis means to study the data obtained and analyse it. It is done to obtain conclusions from the data.
Option b is Statistics. Statistics is a subject that comprises many branches. The picture is undoubtedly part of a branch or subpart of statistics but it is not the entire subject.
Option C is Mensuration. Mensuration is the part of geometry. It is concerned with lengths, areas and volumes.
Option D is data handling, Data handling means to organize the raw data in a representable way so that the data can be easily represented for further studies.
Hence, the correct option is B.
Note: A bar diagram is used to represent the data in a graphical way so that the data can be easily interpreted. The advantages of using a bar diagram is, it is easy to understand. It summarizes a large data set in a visual form. It helps to estimate the key values at a glance.
Recently Updated Pages
Three beakers labelled as A B and C each containing 25 mL of water were taken A small amount of NaOH anhydrous CuSO4 and NaCl were added to the beakers A B and C respectively It was observed that there was an increase in the temperature of the solutions contained in beakers A and B whereas in case of beaker C the temperature of the solution falls Which one of the following statements isarecorrect i In beakers A and B exothermic process has occurred ii In beakers A and B endothermic process has occurred iii In beaker C exothermic process has occurred iv In beaker C endothermic process has occurred
Master Class 11 Social Science: Engaging Questions & Answers for Success
Master Class 11 Physics: Engaging Questions & Answers for Success
Master Class 11 Maths: Engaging Questions & Answers for Success
Master Class 11 Economics: Engaging Questions & Answers for Success
Master Class 11 Computer Science: Engaging Questions & Answers for Success
Three beakers labelled as A B and C each containing 25 mL of water were taken A small amount of NaOH anhydrous CuSO4 and NaCl were added to the beakers A B and C respectively It was observed that there was an increase in the temperature of the solutions contained in beakers A and B whereas in case of beaker C the temperature of the solution falls Which one of the following statements isarecorrect i In beakers A and B exothermic process has occurred ii In beakers A and B endothermic process has occurred iii In beaker C exothermic process has occurred iv In beaker C endothermic process has occurred
Master Class 11 Social Science: Engaging Questions & Answers for Success
Master Class 11 Physics: Engaging Questions & Answers for Success
Trending doubts
One Metric ton is equal to kg A 10000 B 1000 C 100 class 11 physics CBSE
There are 720 permutations of the digits 1 2 3 4 5 class 11 maths CBSE
State and prove Bernoullis theorem class 11 physics CBSE
Draw a diagram of a plant cell and label at least eight class 11 biology CBSE
Difference Between Prokaryotic Cells and Eukaryotic Cells
1 Quintal is equal to a 110 kg b 10 kg c 100kg d 1000 class 11 physics CBSE