


The parking charges of a car Delhi Railway station for first two hours are Rs 50 and Rs 10 for subsequent hours, Write down the equation and draw the graph of this data. Read the charges from the graph: (i) for 1 hour (ii) for 3 hours (iii) for six hours.
Answer
611.7k+ views
Hint- In order to make a graph and to write an equation first we have to assume total hours and total charges as variables then by using a given statement we will try to make an equation.
Complete step-by-step solution -
Given statement is “The parking charges of a car Delhi Railway station for first two hours are Rs 50 and Rs 10 for subsequent hours”
Let total hours = a and total charges = b
Given that the charges for first \[2\] hours is $Rs{\text{ 50}}{\text{.}}$
And total charges for more than \[2\] hours is $Rs{\text{ 10}}{\text{.}}$
So, the remaining hours = total hours – 2
$ = a - 2$
Therefore, total charges for remaining hour =$Rs{\text{ 10(}}a - 2{\text{)}}$
Total charges = charge for the first hour + charges for the remaining hours
$
\Rightarrow b = 50 + 10(a - 2) \\
\Rightarrow b = 50 + 10a - 20 \\
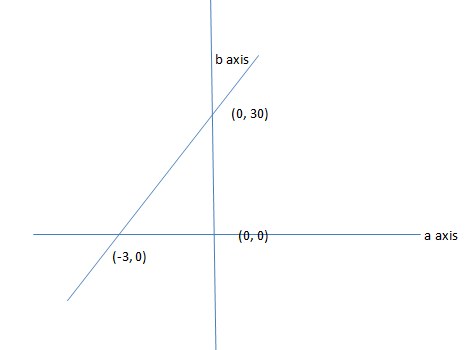
\Rightarrow b = 30 + 10a \\
$
Case I. If a=0
Then $b = 30 + 10 \times 0 = 30$
So, point becomes (0,30)
Case. II if b=0, then
$
0 = 30 + 10a \\
- 30 = 10a \\
a = - 3 \\
$
So, point becomes (-3, 0)
From the graph or the equation we get the following values of charges.
(i) for 1 hour
Charge = Rs. 40
(ii) for 3 hours
Charge = Rs. 60
(iii) for six hours.
Charge = Rs. 90
Note- To solve this type of problem based on data and asked to plot the graph; The first step is to gather all the information given in the question, after collecting the information. Find the information which is missing from the conditions given in the question. To plot a graph an equation of line is required for the points of the x-y axis. After locating the points on the graph, join them, the graph is formed.
Complete step-by-step solution -
Given statement is “The parking charges of a car Delhi Railway station for first two hours are Rs 50 and Rs 10 for subsequent hours”
Let total hours = a and total charges = b
Given that the charges for first \[2\] hours is $Rs{\text{ 50}}{\text{.}}$
And total charges for more than \[2\] hours is $Rs{\text{ 10}}{\text{.}}$
So, the remaining hours = total hours – 2
$ = a - 2$
Therefore, total charges for remaining hour =$Rs{\text{ 10(}}a - 2{\text{)}}$
Total charges = charge for the first hour + charges for the remaining hours
$
\Rightarrow b = 50 + 10(a - 2) \\
\Rightarrow b = 50 + 10a - 20 \\
\Rightarrow b = 30 + 10a \\
$
Case I. If a=0
Then $b = 30 + 10 \times 0 = 30$
So, point becomes (0,30)
Case. II if b=0, then
$
0 = 30 + 10a \\
- 30 = 10a \\
a = - 3 \\
$
So, point becomes (-3, 0)
From the graph or the equation we get the following values of charges.
(i) for 1 hour
Charge = Rs. 40
(ii) for 3 hours
Charge = Rs. 60
(iii) for six hours.
Charge = Rs. 90
Note- To solve this type of problem based on data and asked to plot the graph; The first step is to gather all the information given in the question, after collecting the information. Find the information which is missing from the conditions given in the question. To plot a graph an equation of line is required for the points of the x-y axis. After locating the points on the graph, join them, the graph is formed.
Recently Updated Pages
Master Class 10 Computer Science: Engaging Questions & Answers for Success
Master Class 10 General Knowledge: Engaging Questions & Answers for Success
Master Class 10 English: Engaging Questions & Answers for Success
Master Class 10 Social Science: Engaging Questions & Answers for Success
Master Class 10 Maths: Engaging Questions & Answers for Success
Master Class 10 Science: Engaging Questions & Answers for Success
Trending doubts
What is the median of the first 10 natural numbers class 10 maths CBSE
Which women's tennis player has 24 Grand Slam singles titles?
Who is the Brand Ambassador of Incredible India?
Why is there a time difference of about 5 hours between class 10 social science CBSE
Write a letter to the principal requesting him to grant class 10 english CBSE
A moving boat is observed from the top of a 150 m high class 10 maths CBSE