


The number of integral values of ‘a’ so that \[f\left( x \right)=\mid \left| \left| \left| x \right|-2 \right|+a \right|\]has exactly 7 point of non-differentiability \[\forall x\in R\] is
Answer
558.3k+ views
Hint:To find if any function is non-differentiable or has non-differentiable points is if the graph of that function has or has any sharp curves or bends or any gap between the lines forming the graph. Here we find the graph of the function \[f\left( x \right)=\mid \left| \left| \left| x \right|-2 \right| \right|\] and then we will check how many sharp bends it has and after that we will add ‘a’ to the function and again check the graph to find which value of ‘a’ will give us seven non-differentiable points.
Complete step by step solution:
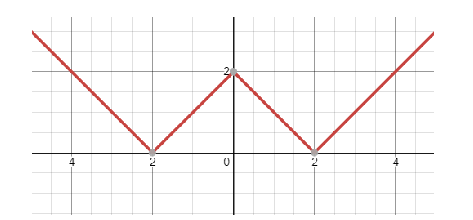
Now to find the point of non-differentiability, we will use the graphical method where we will find the graph of the equation \[f\left( x \right)=\mid \left| \left| \left| x \right|-2 \right|+a \right|\], now the value of ‘a’ is a constant moving the graph along the y-axis and to prove that we will only draw a graph of \[f\left( x \right)=\mid \left| \left| \left| x \right|-2 \right| \right|\] as shown below:

Here we can see that the graph lies on the x-axis so if we add or subtract any constant in mod will always show the graph above x-axis. Now to find the values of ‘a’.
From the graph we can see that the graph is positive hence, the value of \[\left| \left| \left| x \right|-2 \right|+a \right|>0\] . For ‘a’ we take the value of ‘a’ from \[\left( 0,2 \right)\].
For \[x=0\], \[f\left( x \right)=\mid \left| \left| \left| x \right|-2 \right|+a \right|\] we have:
\[\Rightarrow \left| \left| -2 \right|+a \right|>0,x\to 0\]
\[\Rightarrow \left| a \right|>2\]
Now placing the value of ‘a’ in the equation we get the graph as:
\[f\left( x \right)=\mid \left| \left| \left| x \right|-2 \right|+2 \right|\]
For \[x=1\], \[f\left( x \right)=\mid \left| \left| \left| x \right|-2 \right|+a \right|\] we have:
\[\Rightarrow \left| 1\left| -2 \right|+a \right|<0,x\to 0\]
\[\Rightarrow \left| a \right|>-1\]
Now placing the value of ‘a’ in the equation we get the graph as:
\[f\left( x \right)=\mid \left| \left| \left| x \right|-2 \right|+1 \right|\]

For \[x=2\], \[f\left( x \right)=\mid \left| \left| \left| x \right|-2 \right|+a \right|\] we have:
\[\Rightarrow \left| 2\left| -2 \right|+a \right|>0,x\to 0\]
\[\Rightarrow \left| a \right|>0\]
Now placing the value of ‘a’ in the equation we get the graph as:
\[f\left( x \right)=\mid \left| \left| \left| x \right|-2 \right| \right|\]
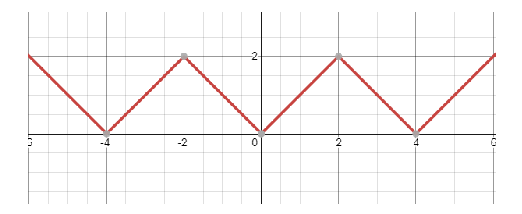
By seeing the diagrams, we can see that for ‘a’ the value that gives the 7 non-differentiable points is when \[a=-1\].
Note: The graphical method in this question may look long and hectic but it is the most easily formed method to find the value of ‘a’ and the triangle tips are the point of non-differentiability. Now the value of ‘a’ should have been positive as the graph lies above the x-axis but due to the mod function, the graph has folded upwards which means if we remove the mod function the real value of ‘a’ should be negative.
Complete step by step solution:
Now to find the point of non-differentiability, we will use the graphical method where we will find the graph of the equation \[f\left( x \right)=\mid \left| \left| \left| x \right|-2 \right|+a \right|\], now the value of ‘a’ is a constant moving the graph along the y-axis and to prove that we will only draw a graph of \[f\left( x \right)=\mid \left| \left| \left| x \right|-2 \right| \right|\] as shown below:
Here we can see that the graph lies on the x-axis so if we add or subtract any constant in mod will always show the graph above x-axis. Now to find the values of ‘a’.
From the graph we can see that the graph is positive hence, the value of \[\left| \left| \left| x \right|-2 \right|+a \right|>0\] . For ‘a’ we take the value of ‘a’ from \[\left( 0,2 \right)\].
For \[x=0\], \[f\left( x \right)=\mid \left| \left| \left| x \right|-2 \right|+a \right|\] we have:
\[\Rightarrow \left| \left| -2 \right|+a \right|>0,x\to 0\]
\[\Rightarrow \left| a \right|>2\]
Now placing the value of ‘a’ in the equation we get the graph as:
\[f\left( x \right)=\mid \left| \left| \left| x \right|-2 \right|+2 \right|\]
For \[x=1\], \[f\left( x \right)=\mid \left| \left| \left| x \right|-2 \right|+a \right|\] we have:
\[\Rightarrow \left| 1\left| -2 \right|+a \right|<0,x\to 0\]
\[\Rightarrow \left| a \right|>-1\]
Now placing the value of ‘a’ in the equation we get the graph as:
\[f\left( x \right)=\mid \left| \left| \left| x \right|-2 \right|+1 \right|\]
For \[x=2\], \[f\left( x \right)=\mid \left| \left| \left| x \right|-2 \right|+a \right|\] we have:
\[\Rightarrow \left| 2\left| -2 \right|+a \right|>0,x\to 0\]
\[\Rightarrow \left| a \right|>0\]
Now placing the value of ‘a’ in the equation we get the graph as:
\[f\left( x \right)=\mid \left| \left| \left| x \right|-2 \right| \right|\]
By seeing the diagrams, we can see that for ‘a’ the value that gives the 7 non-differentiable points is when \[a=-1\].
Note: The graphical method in this question may look long and hectic but it is the most easily formed method to find the value of ‘a’ and the triangle tips are the point of non-differentiability. Now the value of ‘a’ should have been positive as the graph lies above the x-axis but due to the mod function, the graph has folded upwards which means if we remove the mod function the real value of ‘a’ should be negative.
Recently Updated Pages
Master Class 11 Computer Science: Engaging Questions & Answers for Success
Master Class 11 Business Studies: Engaging Questions & Answers for Success
Master Class 11 Economics: Engaging Questions & Answers for Success
Master Class 11 English: Engaging Questions & Answers for Success
Master Class 11 Maths: Engaging Questions & Answers for Success
Master Class 11 Biology: Engaging Questions & Answers for Success
Trending doubts
One Metric ton is equal to kg A 10000 B 1000 C 100 class 11 physics CBSE
There are 720 permutations of the digits 1 2 3 4 5 class 11 maths CBSE
Discuss the various forms of bacteria class 11 biology CBSE
Draw a diagram of a plant cell and label at least eight class 11 biology CBSE
State the laws of reflection of light
Explain zero factorial class 11 maths CBSE