


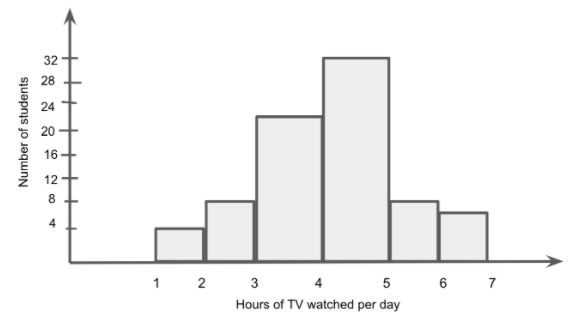
The number of hours for which students of a particular class watched television during holidays is shown through the given graph. Answer the following.
A) For how many hours did the maximum number of students watch TV?
B) How many students watch TV for less than 4 hours?
C) How many students spent more than 5 hours watching TV?
Answer
632.1k+ views
Hint: Here, we from the given graph, we can observe that the bar which is the highest will have the maximum number of students. Then again from the graph, we will just add the bars on the left of 4 on the hours of TV watched per day axis to find the number of students watched TV more than 5 hours and add the bars on the right of 4 on the hours of TV watched per day axis to find the number of students watched TV more than 5 hours.
Complete step by step solution: Since from the given graph, we can observe that the bar 4-5 is the highest among all in the given graph which has 32 students, the maximum students watch TV for 4-5 hours.
From the given graph, we know that the number of students watched TV for less than 4 hours is the bars on the left of 4 on the hours of TV watched per day axis.
So, we will just the find the sum of the number of students watched TV for 1-2 hours, number of students watched TV for 2-3 hours and number of students watched TV for 3-4 hours, we get
\[
\Rightarrow 4 + 8 + 22 \\
\Rightarrow 34{\text{ students}} \\
\]
This implies that 34 students watched TV for less than 4 hours.
Again from the given graph, we know that the number of students watched TV for more than 5 hours is the bars on the right of 5 on the hours of TV watched per day axis.
So, we will just find the sum of the number of students who watched TV for 5-6 hours and number of students watched TV for 6-7 hours, we get
\[
\Rightarrow 8 + 6 \\
\Rightarrow 14{\text{ students}} \\
\]
This implies that 14 students watched TV for more than 5 hours.
Note: Students need to know that a bar graph can be defined as a chart or a graphical representation of data, quantities or numbers using bars or strips. So we use these graphs to compare and contrast numbers, frequencies or other measures of distinct categories of data. We should know that what is asked in question properly, like when we need to find the maximum number of students who watched TV less than 4 hours, we will find the sum of frequencies of bars on left not right. SO be careful with that.
Recently Updated Pages
Master Class 9 General Knowledge: Engaging Questions & Answers for Success
Master Class 9 Maths: Engaging Questions & Answers for Success
Master Class 9 Science: Engaging Questions & Answers for Success
Master Class 9 English: Engaging Questions & Answers for Success
Master Class 9 Social Science: Engaging Questions & Answers for Success
Class 9 Question and Answer - Your Ultimate Solutions Guide
Trending doubts