


The net amount of work done in the given indicator diagram is
a.) Zero
b.) positive
c.) Negative
d.) infinite
Answer
566.4k+ views
Hint: We know that the area under the curve for a graph shows the work done. And also, the work done during the expansion is always larger in the quantity than the work done during the compression. This is always true for a Gas given with a PV diagram showing the cycling work done.
Complete step by step solution:
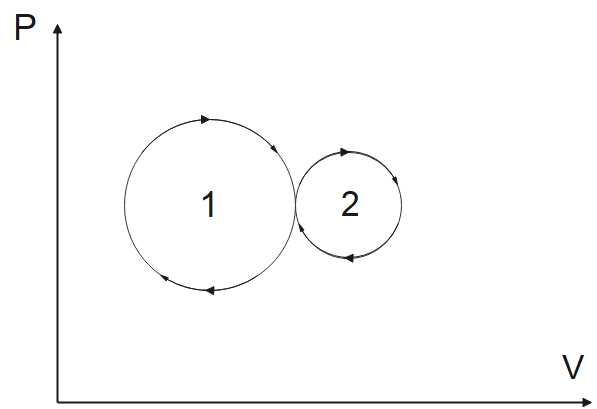
The above diagram is a PV diagram where “P” stands for pressure and “V” stands for volume. This type of diagram is made for a gas in case of work done. Hence, this is a PV diagram for a gas and we need to find the work done.
Now, we know that in case of a gas, the work done is given by
$W=\int{PdV}$
Now on analyzing this formula with the graph we know that the area under the work is given as work done. The clockwise cycle gives a positive work done while the anti-clockwise cycle gives a negative work done. We can see in the above figure that in our case both the cycles are clockwise and hence, the work done will be positive for both the cases. This gives us a result that the net work done will be positive.
Hence, we can conclude that the net work done for the given PV diagram will be positive, the correct answer is (b).
Note: The above question is given with two circles, the above semi-circle shows the expansion of the gas while the lower semi-circle shows the compression of the gas. If we analyze this, we will know that the gas is expanding in moving the upper half circle because the volume is increasing while the gas is undergoing compression for the lower half circle because the volume is decreasing.
Complete step by step solution:
The above diagram is a PV diagram where “P” stands for pressure and “V” stands for volume. This type of diagram is made for a gas in case of work done. Hence, this is a PV diagram for a gas and we need to find the work done.
Now, we know that in case of a gas, the work done is given by
$W=\int{PdV}$
Now on analyzing this formula with the graph we know that the area under the work is given as work done. The clockwise cycle gives a positive work done while the anti-clockwise cycle gives a negative work done. We can see in the above figure that in our case both the cycles are clockwise and hence, the work done will be positive for both the cases. This gives us a result that the net work done will be positive.
Hence, we can conclude that the net work done for the given PV diagram will be positive, the correct answer is (b).
Note: The above question is given with two circles, the above semi-circle shows the expansion of the gas while the lower semi-circle shows the compression of the gas. If we analyze this, we will know that the gas is expanding in moving the upper half circle because the volume is increasing while the gas is undergoing compression for the lower half circle because the volume is decreasing.
Recently Updated Pages
Master Class 11 Social Science: Engaging Questions & Answers for Success
Master Class 11 English: Engaging Questions & Answers for Success
Master Class 11 Maths: Engaging Questions & Answers for Success
Master Class 11 Chemistry: Engaging Questions & Answers for Success
Master Class 11 Biology: Engaging Questions & Answers for Success
Master Class 11 Physics: Engaging Questions & Answers for Success
Trending doubts
Differentiate between an exothermic and an endothermic class 11 chemistry CBSE
One Metric ton is equal to kg A 10000 B 1000 C 100 class 11 physics CBSE
Difference Between Prokaryotic Cells and Eukaryotic Cells
There are 720 permutations of the digits 1 2 3 4 5 class 11 maths CBSE
Draw a diagram of a plant cell and label at least eight class 11 biology CBSE
1 Quintal is equal to a 110 kg b 10 kg c 100kg d 1000 class 11 physics CBSE