


The motion of an object is plotted in four displacement-time graphs. Which of the following graphs given below correctly describes the possible motion of the object?
A.
B.

C.
D.

Answer
480.6k+ views
Hint: Here we are given four graphs, from this some of the graphs has a certain quality that is specifically being rejected in the field of physics if we can point out that quality in the diagrams, we can simply find out which of the diagrams are correct and which of the diagrams are not.
Complete step by step answer:

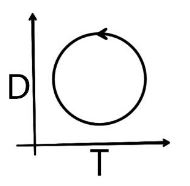
In the first graph we can see that the graph forms a circle, if we focus at the upper half of the graph, we can clearly see that the graph indicates that time is moving backwards which is very absurd in physics.
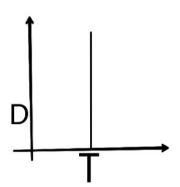
In the second graph we can see that the graph forms two lines one with positive slop and other with negative slope, if we focus at the upper half of the graph which shows the line with negative slope, we can clearly see that the graph indicates that time is moving backwards which is very absurd in physics.

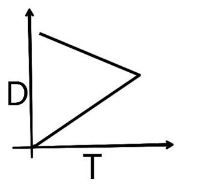
In the third graph we can see that the graph shows a straight line, meaning the object covers a significant amount of distance without any change in time, implying the velocity of the object is infinite which is very absurd in physics.
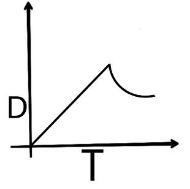
In the fourth graph the time moves in a straight path and the speed initially increases then it accelerates, this implies that the object is in a type of motion that follows the laws of physics.
So, the correct option is D.
Note: Another way to verify the given function of motion is correct or not is by applying a vertical line test. Each correct graph is a function and has all the properties of function, so a correct graph can pass the vertical line test. In this we draw a vertical line and if the line cuts the function or graph only once then it is correct or else it is incorrect. The first three graphs don’t pass the vertical line test (first two cuts the graph twice and the third ones cuts infinite times) where the last ones do.
Complete step by step answer:
In the first graph we can see that the graph forms a circle, if we focus at the upper half of the graph, we can clearly see that the graph indicates that time is moving backwards which is very absurd in physics.
In the second graph we can see that the graph forms two lines one with positive slop and other with negative slope, if we focus at the upper half of the graph which shows the line with negative slope, we can clearly see that the graph indicates that time is moving backwards which is very absurd in physics.
In the third graph we can see that the graph shows a straight line, meaning the object covers a significant amount of distance without any change in time, implying the velocity of the object is infinite which is very absurd in physics.
In the fourth graph the time moves in a straight path and the speed initially increases then it accelerates, this implies that the object is in a type of motion that follows the laws of physics.
So, the correct option is D.
Note: Another way to verify the given function of motion is correct or not is by applying a vertical line test. Each correct graph is a function and has all the properties of function, so a correct graph can pass the vertical line test. In this we draw a vertical line and if the line cuts the function or graph only once then it is correct or else it is incorrect. The first three graphs don’t pass the vertical line test (first two cuts the graph twice and the third ones cuts infinite times) where the last ones do.
Recently Updated Pages
Master Class 11 Computer Science: Engaging Questions & Answers for Success
Master Class 11 Business Studies: Engaging Questions & Answers for Success
Master Class 11 Economics: Engaging Questions & Answers for Success
Master Class 11 English: Engaging Questions & Answers for Success
Master Class 11 Maths: Engaging Questions & Answers for Success
Master Class 11 Biology: Engaging Questions & Answers for Success
Trending doubts
One Metric ton is equal to kg A 10000 B 1000 C 100 class 11 physics CBSE
There are 720 permutations of the digits 1 2 3 4 5 class 11 maths CBSE
Discuss the various forms of bacteria class 11 biology CBSE
Draw a diagram of a plant cell and label at least eight class 11 biology CBSE
State the laws of reflection of light
Explain zero factorial class 11 maths CBSE