


The marks obtained (out of \[20\] ) by $ 30 $ students of a class in a test are given below:
$ 7 $ $ 10 $ $ 6 $ $ 16 $ $ 13 $ $ 14 $ $ 15 $ $ 11 $ $ 18 $ $ 11 $ $ 15 $ $ 7 $ $ 10 $ $ 14 $ $ 20 $ $ 19 $ $ 15 $ $ 16 $ $ 14 $ $ 20 $ $ 10 $ $ 11 $ $ 14 $ $ 17 $ $ 13 $ $ 12 $ $ 15 $ $ 14 $ $ 16 $ $ 17 $
Prepare a frequency distribution table for the above data using class intervals of equal width in which one class interval is $ 3 - 8 $ (including $ 3 $ and excluding $ 8 $ ). From the frequency distribution table so obtained, draw a histogram.
| $ 7 $ | $ 10 $ | $ 6 $ | $ 16 $ | $ 13 $ |
| $ 14 $ | $ 15 $ | $ 11 $ | $ 18 $ | $ 11 $ |
| $ 15 $ | $ 7 $ | $ 10 $ | $ 14 $ | $ 20 $ |
| $ 19 $ | $ 15 $ | $ 16 $ | $ 14 $ | $ 20 $ |
| $ 10 $ | $ 11 $ | $ 14 $ | $ 17 $ | $ 13 $ |
| $ 12 $ | $ 15 $ | $ 14 $ | $ 16 $ | $ 17 $ |
Answer
591.9k+ views
Hint: Divide the marks of the students according to the intervals given and calculate the frequency by calculating the number of students in the particular interval.
Complete step-by-step answer:
The marks obtained (out of \[20\] ) by $ 30 $ students of a class in a test are given below:
We are given marks of \[30\] students. Make the intervals of the same width and count the number of students in a particular interval according to the marks distribution for the frequency table of the marks obtained by the students.
Hence, the frequency table shows the count of the number of students in each class interval of the marks obtained by the students of a class.
Now draw the histogram of the frequency distribution table listed above:
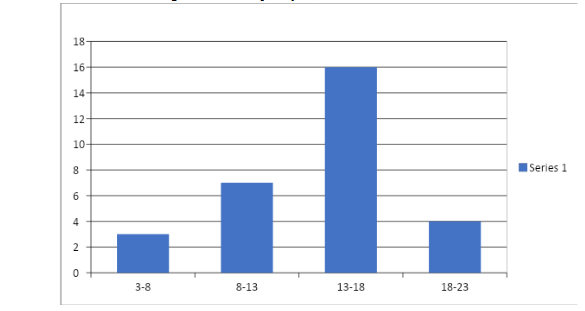
Above figure shows the histogram of the frequency table for the marks of students of a class in a test.
Note: In this problem take care of the number of students in the particular interval and also take the calculation of students for the frequency of different intervals carefully and match the sum of frequency with number of students to cross check.
Complete step-by-step answer:
The marks obtained (out of \[20\] ) by $ 30 $ students of a class in a test are given below:
| $ 7 $ | $ 10 $ | $ 6 $ | $ 16 $ | $ 13 $ |
| $ 14 $ | $ 15 $ | $ 11 $ | $ 18 $ | $ 11 $ |
| $ 15 $ | $ 7 $ | $ 10 $ | $ 14 $ | $ 20 $ |
| $ 19 $ | $ 15 $ | $ 16 $ | $ 14 $ | $ 20 $ |
| $ 10 $ | $ 11 $ | $ 14 $ | $ 17 $ | $ 13 $ |
| $ 12 $ | $ 15 $ | $ 14 $ | $ 16 $ | $ 17 $ |
We are given marks of \[30\] students. Make the intervals of the same width and count the number of students in a particular interval according to the marks distribution for the frequency table of the marks obtained by the students.
| Intervals | Frequency |
| $ 3 - 8 $ | $ 3 $ |
| $ 8 - 13 $ | $ 7 $ |
| $ 13 - 18 $ | $ 16 $ |
| $ 18 - 23 $ | $ 4 $ |
Hence, the frequency table shows the count of the number of students in each class interval of the marks obtained by the students of a class.
Now draw the histogram of the frequency distribution table listed above:
Above figure shows the histogram of the frequency table for the marks of students of a class in a test.
Note: In this problem take care of the number of students in the particular interval and also take the calculation of students for the frequency of different intervals carefully and match the sum of frequency with number of students to cross check.
Recently Updated Pages
Master Class 12 Business Studies: Engaging Questions & Answers for Success
Master Class 12 Biology: Engaging Questions & Answers for Success
Master Class 12 Chemistry: Engaging Questions & Answers for Success
Class 12 Question and Answer - Your Ultimate Solutions Guide
Master Class 11 Social Science: Engaging Questions & Answers for Success
Master Class 11 English: Engaging Questions & Answers for Success
Trending doubts
Find the sum of series 1 + 2 + 3 + 4 + 5 + + 100 class 9 maths CBSE
Fill the blanks with the suitable prepositions 1 The class 9 english CBSE
Difference Between Plant Cell and Animal Cell
How many hours before the closure of election must class 9 social science CBSE
What is pollution? How many types of pollution? Define it
What is the Full Form of ICSE / ISC ?