


The marks obtained by 100 students of a class in an examination are given below.
Marks \[0 - 5\] \[5 - 10\] \[10 - 15\] \[15 - 20\] \[20 - 25\] \[25 - 30\] \[30 - 35\] \[35 - 40\] \[40 - 45\] \[45 - 50\] No. of Students $2$ $5$ $6$ $8$ $10$ $25$ $20$ $18$ $4$ $2$
Draw a less than type Cumulative Frequency Curve (Ogive). Hence Find the Median.
| Marks | \[0 - 5\] | \[5 - 10\] | \[10 - 15\] | \[15 - 20\] | \[20 - 25\] | \[25 - 30\] | \[30 - 35\] | \[35 - 40\] | \[40 - 45\] | \[45 - 50\] |
| No. of Students | $2$ | $5$ | $6$ | $8$ | $10$ | $25$ | $20$ | $18$ | $4$ | $2$ |
Answer
592.2k+ views
Hint: In this question we will convert the frequency table to a cumulative frequency table and plot the graph and then draw its ogive, and hence find the median.
Complete step-by-step solution:
To draw an ogive we require the cumulative frequencies of the values
The distribution table can be written as:
Now to find the Cumulative frequencies in a less than type cumulative frequency we add all the preceding terms to the current term, Therefore the cumulative frequency table could be written as:
Upon simplifying the above table, we get:
Now, we have to plot the graph with taking the upper limit of Marks on X-axis and the respective cumulative frequency on the Y-axis to get the less than ogive.
The points to be plotted to make a less than ogive are on the graph are: $(5,2),(10,7),(15,13),(20,21),(25,31),(30,56),(35,76),(40,94),(45,98),(50,100)$
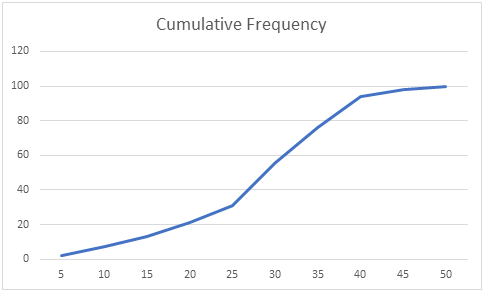
The Curve in the above graph is the Cumulative Frequency Curve i.e. The ogive.
Now to find the median:
Let $N$ be the total number of students whose data is given.
Also $N$ will be the cumulative frequency of the last interval.
We find the ${\left[ {\dfrac{N}{2}} \right]^{th}}$ item (student) and mark it on the y-axis.
In this case the ${\left[ {\dfrac{N}{2}} \right]^{th}}$ item (student) is ${(100/2)^{th}}$ = ${50^{th}}$ student.
We draw a perpendicular from $50$ to the right to cut the Ogive curve.
From where the Ogive curve is cut, draw a perpendicular on the x-axis. The point at which it touches the x-axis will be the median value of the series as shown in the graph:
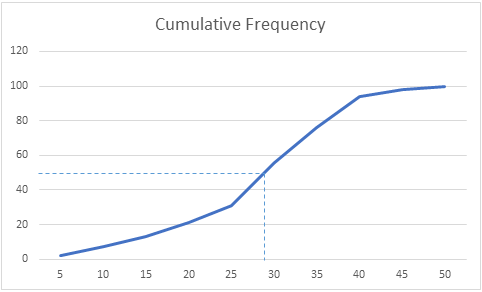
$\therefore $ From the above Graph we can see that the median is $29$
Hence we get the required answer.
Note: The cumulative frequency should always be plotted on the Y-axis to get a correct ogive.
There also exists a more than ogive, in this type of ogive while making the cumulative frequency table, all the succeeding terms in the distribution should be added to a term in the table.
Complete step-by-step solution:
To draw an ogive we require the cumulative frequencies of the values
The distribution table can be written as:
| Marks | No. of Students |
| \[0 - 5\] | $2$ |
| \[5 - 10\] | $5$ |
| \[10 - 15\] | $6$ |
| \[15 - 20\] | $8$ |
| \[20 - 25\] | $10$ |
| \[25 - 30\] | $25$ |
| \[30 - 35\] | $20$ |
| \[35 - 40\] | $18$ |
| \[40 - 45\] | $4$ |
| \[45 - 50\] | $2$ |
Now to find the Cumulative frequencies in a less than type cumulative frequency we add all the preceding terms to the current term, Therefore the cumulative frequency table could be written as:
| Marks | No. of Students | Cumulative Frequency |
| \[0 - 5\] | $2$ | $2$ |
| \[5 - 10\] | $5$ | $2 + 5$ |
| \[10 - 15\] | $6$ | $2 + 5 + 6$ |
| \[15 - 20\] | $8$ | $2 + 5 + 6 + 8$ |
| \[20 - 25\] | $10$ | $2 + 5 + 6 + 8 + 10$ |
| \[25 - 30\] | $25$ | $2 + 5 + 6 + 8 + 10 + 25$ |
| \[30 - 35\] | $20$ | $2 + 5 + 6 + 8 + 10 + 25 + 20$ |
| \[35 - 40\] | $18$ | $2 + 5 + 6 + 8 + 10 + 25 + 20 + 18$ |
| \[40 - 45\] | $4$ | $2 + 5 + 6 + 8 + 10 + 25 + 20 + 18 + 4$ |
| \[45 - 50\] | $2$ | $2 + 5 + 6 + 8 + 10 + 25 + 20 + 18 + 4 + 2$ |
Upon simplifying the above table, we get:
| Marks | No. of Students | Cumulative Frequency |
| \[0 - 5\] | $2$ | $2$ |
| \[5 - 10\] | $5$ | $7$ |
| \[10 - 15\] | $6$ | $13$ |
| \[15 - 20\] | $8$ | $21$ |
| \[20 - 25\] | $10$ | $31$ |
| \[25 - 30\] | $25$ | $56$ |
| \[30 - 35\] | $20$ | $76$ |
| \[35 - 40\] | $18$ | $94$ |
| \[40 - 45\] | $4$ | $98$ |
| \[45 - 50\] | $2$ | $100$ |
Now, we have to plot the graph with taking the upper limit of Marks on X-axis and the respective cumulative frequency on the Y-axis to get the less than ogive.
The points to be plotted to make a less than ogive are on the graph are: $(5,2),(10,7),(15,13),(20,21),(25,31),(30,56),(35,76),(40,94),(45,98),(50,100)$
The Curve in the above graph is the Cumulative Frequency Curve i.e. The ogive.
Now to find the median:
Let $N$ be the total number of students whose data is given.
Also $N$ will be the cumulative frequency of the last interval.
We find the ${\left[ {\dfrac{N}{2}} \right]^{th}}$ item (student) and mark it on the y-axis.
In this case the ${\left[ {\dfrac{N}{2}} \right]^{th}}$ item (student) is ${(100/2)^{th}}$ = ${50^{th}}$ student.
We draw a perpendicular from $50$ to the right to cut the Ogive curve.
From where the Ogive curve is cut, draw a perpendicular on the x-axis. The point at which it touches the x-axis will be the median value of the series as shown in the graph:
$\therefore $ From the above Graph we can see that the median is $29$
Hence we get the required answer.
Note: The cumulative frequency should always be plotted on the Y-axis to get a correct ogive.
There also exists a more than ogive, in this type of ogive while making the cumulative frequency table, all the succeeding terms in the distribution should be added to a term in the table.
Recently Updated Pages
Three beakers labelled as A B and C each containing 25 mL of water were taken A small amount of NaOH anhydrous CuSO4 and NaCl were added to the beakers A B and C respectively It was observed that there was an increase in the temperature of the solutions contained in beakers A and B whereas in case of beaker C the temperature of the solution falls Which one of the following statements isarecorrect i In beakers A and B exothermic process has occurred ii In beakers A and B endothermic process has occurred iii In beaker C exothermic process has occurred iv In beaker C endothermic process has occurred
Master Class 11 Social Science: Engaging Questions & Answers for Success
Master Class 11 Physics: Engaging Questions & Answers for Success
Master Class 11 Maths: Engaging Questions & Answers for Success
Master Class 11 Economics: Engaging Questions & Answers for Success
Master Class 11 Computer Science: Engaging Questions & Answers for Success
Three beakers labelled as A B and C each containing 25 mL of water were taken A small amount of NaOH anhydrous CuSO4 and NaCl were added to the beakers A B and C respectively It was observed that there was an increase in the temperature of the solutions contained in beakers A and B whereas in case of beaker C the temperature of the solution falls Which one of the following statements isarecorrect i In beakers A and B exothermic process has occurred ii In beakers A and B endothermic process has occurred iii In beaker C exothermic process has occurred iv In beaker C endothermic process has occurred
Master Class 11 Social Science: Engaging Questions & Answers for Success
Master Class 11 Physics: Engaging Questions & Answers for Success
Trending doubts
One Metric ton is equal to kg A 10000 B 1000 C 100 class 11 physics CBSE
There are 720 permutations of the digits 1 2 3 4 5 class 11 maths CBSE
State and prove Bernoullis theorem class 11 physics CBSE
Draw a diagram of a plant cell and label at least eight class 11 biology CBSE
Difference Between Prokaryotic Cells and Eukaryotic Cells
1 Quintal is equal to a 110 kg b 10 kg c 100kg d 1000 class 11 physics CBSE