


The marks obtained by 100 students in a Mathematics test are given below:
Marks No. of students $0 - 10$ $3$ $10 - 20$ $7$ $20 - 30$ $12$ $30 - 40$ $17$ $40 - 50$ $23$ $50 - 60$ $14$ $60 - 70$ $9$ $70 - 80$ $6$ $80 - 90$ $5$ $90 - 100$ $4$
Draw an ogive for the given distribution on a graph sheet. Use the ogive to estimate the number of students who obtained more than $85\% $ marks in the test.
(Use a scale of $2cm = 10$ units on both axes).
| Marks | No. of students |
| $0 - 10$ | $3$ |
| $10 - 20$ | $7$ |
| $20 - 30$ | $12$ |
| $30 - 40$ | $17$ |
| $40 - 50$ | $23$ |
| $50 - 60$ | $14$ |
| $60 - 70$ | $9$ |
| $70 - 80$ | $6$ |
| $80 - 90$ | $5$ |
| $90 - 100$ | $4$ |
Answer
614.7k+ views
Hint: In this question, we have been asked to draw the ogive and then use it to find the number of students who obtained more than $85\% $ marks in the test. To draw an ogive, first make a table of cumulative frequency and then mark it on the graph. Take marks on x-axis and cumulative frequency on y-axis and allot the points. This will make less than ogive. Then see the point corresponding to 85 of x-axis.
Complete step-by-step solution:
We are given the marks obtained by 100 students in a mathematics test and we have been asked to make an ogive. An ogive can either be drawn for less than ogive, and more than or greater than ogive.
Let us draw less than ogive. In this type of ogive, the frequencies of all the preceding class are added to the frequency of that class. Let us make a table of cumulative frequency.
Now, we have been told that we have to use the scale of $2cm = 10$units.
Let us mark the points on the graph.
On x-axis, we will take marks and on y-axis, we will take cumulative frequency. So, the points to be marked are- $(10,3),(20,10),(30,22),(40,39),(50,62),(60,76),(70,85),(80,91),(90,96),(100,100)$.
Plotting them on the graph,
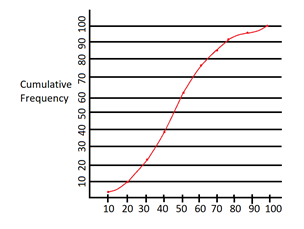
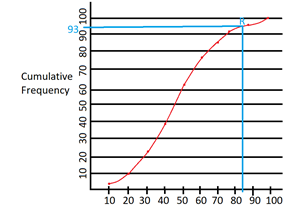
This is the one of the given distributions. It is basically the graphical representation of cumulative frequency. Now, let us use the ogive to estimate the number of students who scored more than $85\% $. For this, we will draw a vertical line passing through 85 on the x-axis (because marks are shown on x-axis). Then, we will mark the intersection of the vertical line and ogive as point R. Then we will draw a horizontal line passing through point R and see where it intersects on the y-axis.
As we can see, the horizontal line intersects the y-axis at $93$. Therefore, 93 students scored less than $85\% $.
Number of students scoring more than $85\% $ are $100 - 93 = 7$.
Note: The points are only plotted on the upper limit of the class interval and not on lower limit.
The points are only plotted on the upper limit of the class interval and not on lower limits. It means that we took the upper limits as abscissa.
Complete step-by-step solution:
We are given the marks obtained by 100 students in a mathematics test and we have been asked to make an ogive. An ogive can either be drawn for less than ogive, and more than or greater than ogive.
Let us draw less than ogive. In this type of ogive, the frequencies of all the preceding class are added to the frequency of that class. Let us make a table of cumulative frequency.
| Marks | No. of students | Cumulative frequency |
| $0 - 10$ | $3$ | $3$ |
| $10 - 20$ | $7$ | $3 + 7 = 10$ |
| $20 - 30$ | $12$ | $10 + 12 = 22$ |
| $30 - 40$ | $17$ | $22 + 17 = 39$ |
| $40 - 50$ | $23$ | $39 + 23 = 62$ |
| $50 - 60$ | $14$ | $62 + 14 = 76$ |
| $60 - 70$ | $9$ | $76 + 9 = 85$ |
| $70 - 80$ | $6$ | $85 + 6 = 91$ |
| $80 - 90$ | $5$ | $91 + 5 = 96$ |
| $90 - 100$ | $4$ | $96 + 4 = 100$ |
Now, we have been told that we have to use the scale of $2cm = 10$units.
Let us mark the points on the graph.
On x-axis, we will take marks and on y-axis, we will take cumulative frequency. So, the points to be marked are- $(10,3),(20,10),(30,22),(40,39),(50,62),(60,76),(70,85),(80,91),(90,96),(100,100)$.
Plotting them on the graph,
This is the one of the given distributions. It is basically the graphical representation of cumulative frequency. Now, let us use the ogive to estimate the number of students who scored more than $85\% $. For this, we will draw a vertical line passing through 85 on the x-axis (because marks are shown on x-axis). Then, we will mark the intersection of the vertical line and ogive as point R. Then we will draw a horizontal line passing through point R and see where it intersects on the y-axis.
As we can see, the horizontal line intersects the y-axis at $93$. Therefore, 93 students scored less than $85\% $.
Number of students scoring more than $85\% $ are $100 - 93 = 7$.
Note: The points are only plotted on the upper limit of the class interval and not on lower limit.
The points are only plotted on the upper limit of the class interval and not on lower limits. It means that we took the upper limits as abscissa.
Recently Updated Pages
Master Class 11 English: Engaging Questions & Answers for Success
Master Class 11 Social Science: Engaging Questions & Answers for Success
Master Class 11 Maths: Engaging Questions & Answers for Success
Master Class 11 Biology: Engaging Questions & Answers for Success
Master Class 11 Physics: Engaging Questions & Answers for Success
Master Class 11 Chemistry: Engaging Questions & Answers for Success
Trending doubts
One Metric ton is equal to kg A 10000 B 1000 C 100 class 11 physics CBSE
What is cell theory Who formulated it class 11 biology CBSE
Phyllotaxy is the arrangement of ALeaflets BLeaves class 11 biology CBSE
Difference Between Prokaryotic Cells and Eukaryotic Cells
The symbiotic association of fungi and algae is called class 11 biology CBSE
Cell theory was formulated by A Schleiden and Schwann class 11 biology CBSE