


The lengths in km (rounded to nearest hundred)
of some major rivers of India are given below:
Draw a bar graph to represent the above information.
River Length in (km) Narmada 1300 Mahanadi 900 Brahmaputra 2900 Ganga 2500 Kaveri 800 Krishna 1300
| River | Length in (km) |
| Narmada | 1300 |
| Mahanadi | 900 |
| Brahmaputra | 2900 |
| Ganga | 2500 |
| Kaveri | 800 |
| Krishna | 1300 |
Answer
588.9k+ views
Hint: We recall shapes of the bar plot and we draw the bars vertically. We take vertical bars of equal width at equal distance with each other on the horizontal axis and take the length of the rivers in kilometers in the vertical axis on the left side with a small division equal to 100 kilometers. \[\]
Complete step-by-step solution:
We know that a bar chart or bar graph is a chart or graph that presents grouped data with rectangular bars with heights or lengths proportional to the values that they represent. The bars can be plotted vertically on the horizontal axis or horizontally on the vertical axis. A vertical bar chart is sometimes called a column chart. We observe the given table. \[\]
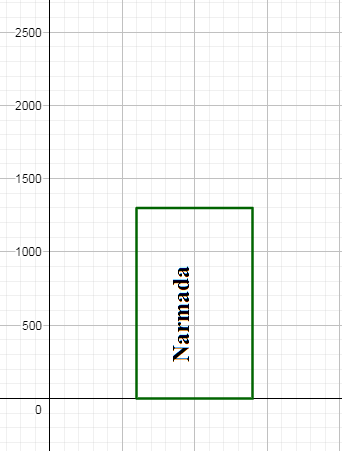
We see that in the left column we are given the names of the rivers and in the right column their length. We draw the bar for the river Narmada with any width (we have taken width 8 here) and draw height equal to $\dfrac{1300}{100}=13$ small divisions. Since each division is 100 km , 13 divisions will represent $13\times 100=1300$ km. \[\]
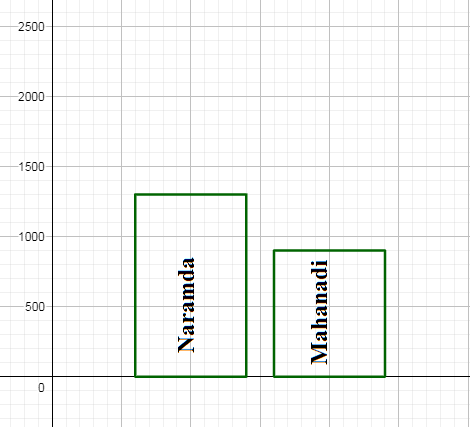
We draw the next bar for the river Mahanadi at some distance from the bar for Narmada with the same width we took for Narmada and height equal to $\dfrac{900}{100}=9$ small divisions. \[\]
We similarly draw the bars the Brahmaputra, Ganga, Kaveri, Krishna river with the same width and equal distance with each other and height $\dfrac{2900}{100}=29,\dfrac{2500}{100}=25,\dfrac{800}{100}=8,\dfrac{1300}{100}=13$ small divisions respectively. We have the bar plot as, \[\]
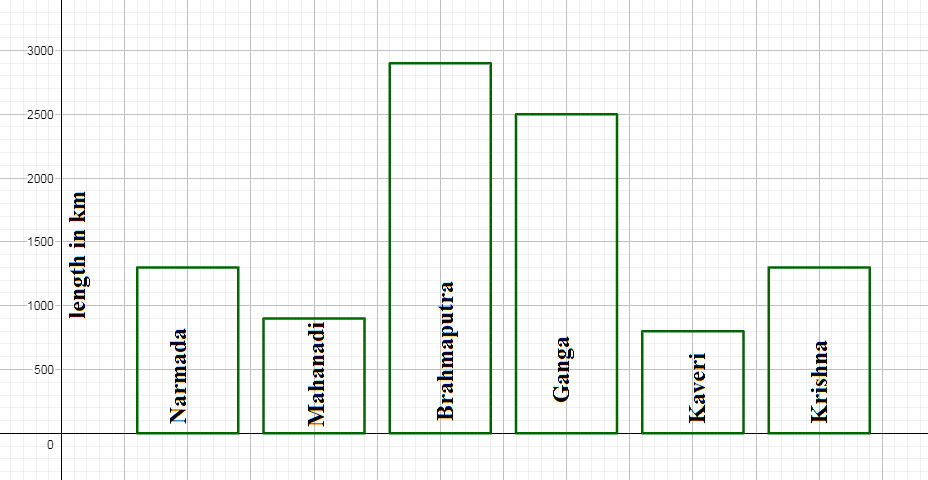
Note: We can also draw horizontal bars on the vertical axis. There are two other types of bar chart grouped bar charts where two or more colored bars close to each other and stacked bar charts where bars are on top of each other represent different groups. The histogram is a special type of vertical bar chart with continuous data on the horizontal axis where all the bars are close to each other.
Complete step-by-step solution:
We know that a bar chart or bar graph is a chart or graph that presents grouped data with rectangular bars with heights or lengths proportional to the values that they represent. The bars can be plotted vertically on the horizontal axis or horizontally on the vertical axis. A vertical bar chart is sometimes called a column chart. We observe the given table. \[\]
| River | Length in (km) |
| Narmada | 1300 |
| Mahanadi | 900 |
| Brahmaputra | 2900 |
| Ganga | 2500 |
| Kaveri | 800 |
| Krishna | 1300 |
We see that in the left column we are given the names of the rivers and in the right column their length. We draw the bar for the river Narmada with any width (we have taken width 8 here) and draw height equal to $\dfrac{1300}{100}=13$ small divisions. Since each division is 100 km , 13 divisions will represent $13\times 100=1300$ km. \[\]
We draw the next bar for the river Mahanadi at some distance from the bar for Narmada with the same width we took for Narmada and height equal to $\dfrac{900}{100}=9$ small divisions. \[\]
We similarly draw the bars the Brahmaputra, Ganga, Kaveri, Krishna river with the same width and equal distance with each other and height $\dfrac{2900}{100}=29,\dfrac{2500}{100}=25,\dfrac{800}{100}=8,\dfrac{1300}{100}=13$ small divisions respectively. We have the bar plot as, \[\]
Note: We can also draw horizontal bars on the vertical axis. There are two other types of bar chart grouped bar charts where two or more colored bars close to each other and stacked bar charts where bars are on top of each other represent different groups. The histogram is a special type of vertical bar chart with continuous data on the horizontal axis where all the bars are close to each other.
Recently Updated Pages
Three beakers labelled as A B and C each containing 25 mL of water were taken A small amount of NaOH anhydrous CuSO4 and NaCl were added to the beakers A B and C respectively It was observed that there was an increase in the temperature of the solutions contained in beakers A and B whereas in case of beaker C the temperature of the solution falls Which one of the following statements isarecorrect i In beakers A and B exothermic process has occurred ii In beakers A and B endothermic process has occurred iii In beaker C exothermic process has occurred iv In beaker C endothermic process has occurred
Master Class 10 Social Science: Engaging Questions & Answers for Success
Master Class 10 Science: Engaging Questions & Answers for Success
Master Class 10 Maths: Engaging Questions & Answers for Success
Master Class 10 General Knowledge: Engaging Questions & Answers for Success
Master Class 10 Computer Science: Engaging Questions & Answers for Success
Three beakers labelled as A B and C each containing 25 mL of water were taken A small amount of NaOH anhydrous CuSO4 and NaCl were added to the beakers A B and C respectively It was observed that there was an increase in the temperature of the solutions contained in beakers A and B whereas in case of beaker C the temperature of the solution falls Which one of the following statements isarecorrect i In beakers A and B exothermic process has occurred ii In beakers A and B endothermic process has occurred iii In beaker C exothermic process has occurred iv In beaker C endothermic process has occurred
Master Class 10 Social Science: Engaging Questions & Answers for Success
Master Class 10 Science: Engaging Questions & Answers for Success
Trending doubts
Explain the Treaty of Vienna of 1815 class 10 social science CBSE
In cricket, what is the term for a bowler taking five wickets in an innings?
Who Won 36 Oscar Awards? Record Holder Revealed
What is the median of the first 10 natural numbers class 10 maths CBSE
Why is it 530 pm in india when it is 1200 afternoon class 10 social science CBSE
What is deficiency disease class 10 biology CBSE