


The length of 40 leaves of a plant are measured correct to one millimetre, and the obtained data is represented in the following table
i) Draw a histogram to represent the given data (Hint: First make the class intervals continuous]
ii) Is there any other suitable graphical representation for the same data?
iii) Is it correct to conclude that the maximum number of leaves are 153mm long? Why?
Length in mm Number of leaves 118-126 3 127-135 5 136-144 9 145-153 12 154-162 5 163-172 4 172-180 2
| Length in mm | Number of leaves |
| 118-126 | 3 |
| 127-135 | 5 |
| 136-144 | 9 |
| 145-153 | 12 |
| 154-162 | 5 |
| 163-172 | 4 |
| 172-180 | 2 |
Answer
628.2k+ views
Hint: Before starting with graphical representation, we should convert the discontinuous classes into continuous class, as they have asked for a histogram. Then, we shall choose the axis of the graph, by taking the number of leaves as y-axis and length of the leaf on x-axis.
Complete step-by-step answer:
The Difference Between Bar Charts and Histograms
With bar charts, each column represents a group defined by a categorical variable; and with histograms, each column represents a group defined by a continuous, quantitative variable.
We shall first convert the discontinuous classes into continuous classes.
In order to do so consider
\[{\text{Adjustment }} = {\text{ }}\dfrac{1}{2}{\text{[lower limit class - upper limit of previous]}}\]
So, we get adjustment: $ = \dfrac{1}{2}[127 - 126] = \dfrac{1}{2} = 0.5 $
Therefore, subtract 0.5 from upper limit of previous class & lower limit of next class.
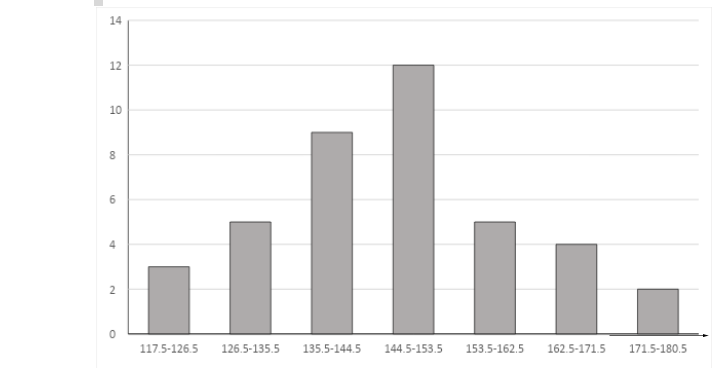
i.Now, to draw the histogram we choose number of leaves on Y-axis and length on X-axis
ii.Yes we can also represent it through frequency polygon.
iii.No, we cannot conclude that, maximum number of leaves is 153 mm. It is a range. We can say that, maximum number of leaves lies between 144.5mm - 153.5 mm.
Note: Remember that in order to draw a histogram, there should be continuous class intervals. Otherwise, we cannot draw a histogram.so convent the discontinuous class interval to continuous class and then start the graphical representation.
Complete step-by-step answer:
The Difference Between Bar Charts and Histograms
With bar charts, each column represents a group defined by a categorical variable; and with histograms, each column represents a group defined by a continuous, quantitative variable.
We shall first convert the discontinuous classes into continuous classes.
In order to do so consider
\[{\text{Adjustment }} = {\text{ }}\dfrac{1}{2}{\text{[lower limit class - upper limit of previous]}}\]
So, we get adjustment: $ = \dfrac{1}{2}[127 - 126] = \dfrac{1}{2} = 0.5 $
Therefore, subtract 0.5 from upper limit of previous class & lower limit of next class.
| Length in mm | New Length in mm | Number of leaves |
| 118-126 | 117.5-126.5 | 3 |
| 127-135 | 126.5-135.5 | 5 |
| 136-144 | 135.5-144.5 | 9 |
| 145-153 | 144.5-153.5 | 12 |
| 154-162 | 153.5-162.5 | 5 |
| 163-171 | 162.5-171.5 | 4 |
| 172-180 | 171.5-180.5 | 2 |
i.Now, to draw the histogram we choose number of leaves on Y-axis and length on X-axis
ii.Yes we can also represent it through frequency polygon.
iii.No, we cannot conclude that, maximum number of leaves is 153 mm. It is a range. We can say that, maximum number of leaves lies between 144.5mm - 153.5 mm.
Note: Remember that in order to draw a histogram, there should be continuous class intervals. Otherwise, we cannot draw a histogram.so convent the discontinuous class interval to continuous class and then start the graphical representation.
Recently Updated Pages
Master Class 11 English: Engaging Questions & Answers for Success
Master Class 11 Social Science: Engaging Questions & Answers for Success
Master Class 11 Maths: Engaging Questions & Answers for Success
Master Class 11 Biology: Engaging Questions & Answers for Success
Master Class 11 Physics: Engaging Questions & Answers for Success
Master Class 11 Chemistry: Engaging Questions & Answers for Success
Trending doubts
What is BLO What is the full form of BLO class 8 social science CBSE
Citizens of India can vote at the age of A 18 years class 8 social science CBSE
Full form of STD, ISD and PCO
Give me the opposite gender of Duck class 8 english CBSE
Advantages and disadvantages of science
What is the difference between rai and mustard see class 8 biology CBSE