


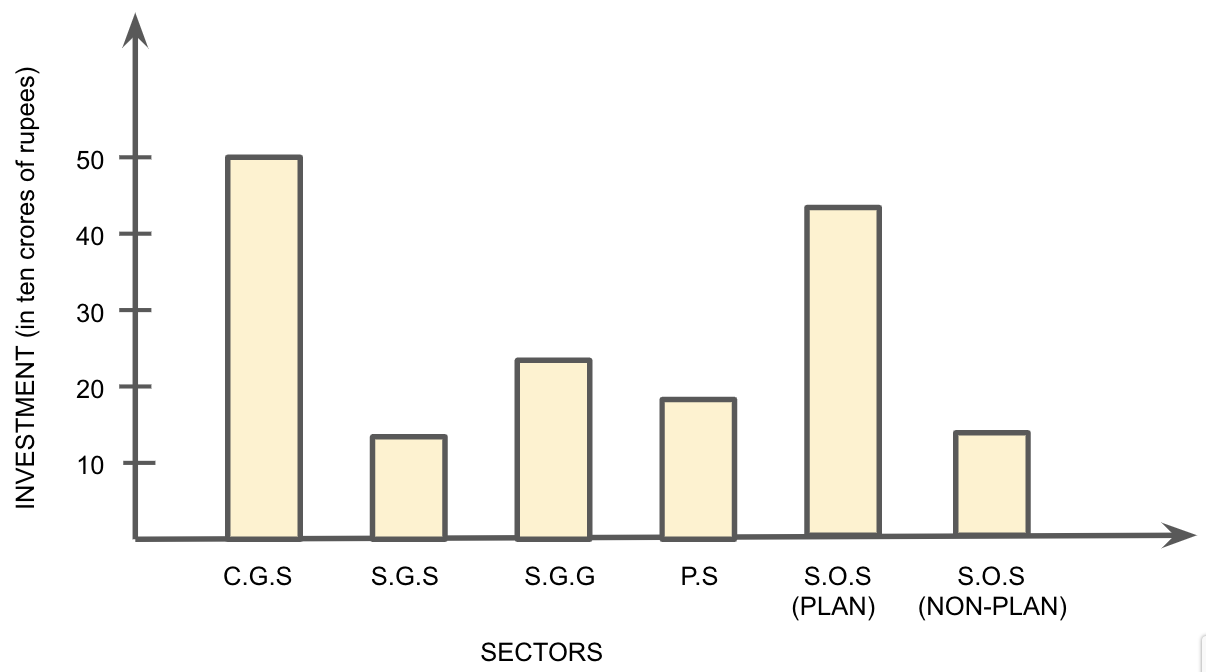
The investment (in ten crores of rupees) of Life Insurance Corporation of India in different sectors are given below:
SECTORS INVESTMENT (in ten crores of rupees) Central Government Securities 45 State Government Securities 11 Securities guaranteed by the Government 23 Private Sectors 18 Socially Oriented Sectors (Plan) 46 Socially Oriented Sectors (Non-Plan) 11
Represent the above data with the help of a bar graph.
| SECTORS | INVESTMENT (in ten crores of rupees) |
| Central Government Securities | 45 |
| State Government Securities | 11 |
| Securities guaranteed by the Government | 23 |
| Private Sectors | 18 |
| Socially Oriented Sectors (Plan) | 46 |
| Socially Oriented Sectors (Non-Plan) | 11 |
Answer
629.1k+ views
Hint: Here, we will make the horizontal and vertical axes represent the sectors and the investment in ten Crores of rupees respectively. Then we will draw 6 bars of different lengths given in the table, so at first, we will mark 6 points in the horizontal axis at equal distances and erect rectangles of the same width at these points.
Complete step by step answer:
To represent the given data by a vertical bar graph, we first draw horizontal and vertical axes.
Let us now consider that the horizontal and vertical axes represent the sectors and the investment in ten Crores of rupees respectively.
We have to draw 6 bars of different lengths given in the table.
At first, we will mark 6 points in the horizontal axis at equal distances and erect rectangles of the same width at these points.
So, we know the heights of the rectangles are proportional to the investments of Life Insurance Corporation of India.
We will now draw the vertical bar graph of the given data where 1 unit in the vertical axis represents 10.
Note: Students need to know that a bar graph can be defined as a chart or a graphical representation of data, quantities, or numbers using bars or strips. So we use these graphs to compare and contrast numbers, frequencies, or other measures of distinct categories of data. We should know that what is asked in question properly, like when we need to mark a bar graph of one sector to mark the investment for each. So be careful with that.
Recently Updated Pages
Master Class 11 English: Engaging Questions & Answers for Success
Master Class 11 Social Science: Engaging Questions & Answers for Success
Master Class 11 Maths: Engaging Questions & Answers for Success
Master Class 11 Biology: Engaging Questions & Answers for Success
Master Class 11 Physics: Engaging Questions & Answers for Success
Master Class 11 Chemistry: Engaging Questions & Answers for Success
Trending doubts
Explain the Treaty of Vienna of 1815 class 10 social science CBSE
What is the Total Duration of Football Match?
The shortest day of the year in India
In which year voting age was reduced from 21 to 18?
10 examples of evaporation in daily life with explanations
What planets have no moons Which one has only one moon class 10 physics CBSE