


The horizontal line in the graph is called:
(a) x-axis
(b) y-axis
(c) line
(d) none
Answer
608.1k+ views
Hint: We will first look at the components that make this graph. We will see the definitions of these components of the graph. We should be able to obtain the answer by looking at the definitions of the components of the given graph.
Complete step by step answer:
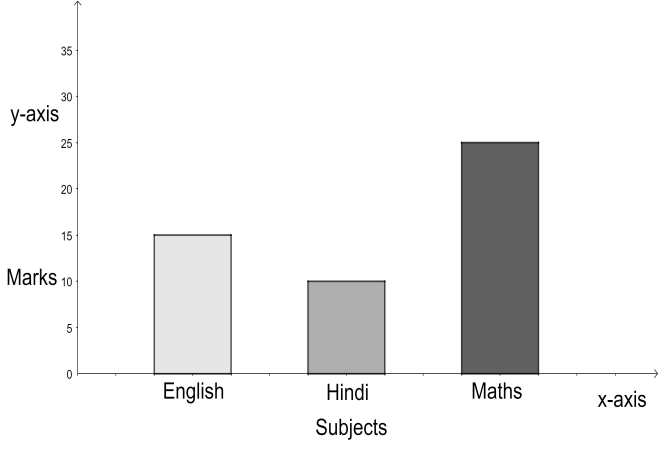
The given graph is a bar graph. From the figure, we can see that the graph is representing a relation between subjects and marks. On the horizontal line, we see three subjects that are English, Hindi and Maths. On the vertical line, we see the marks. The height of the bars drawn for each subject show the marks for that particular subject. So, for English we have 15 marks, for Hindi we have 10 marks and for Maths we have 25 marks. The horizontal axis is the x-axis and the vertical axis is the y-axis. The x-axis and the y-axis form the xy-plane.
So, the correct answer is “Option A”.
Note: In general, a graph is a set of ordered pairs $\left( x,y \right)$ where the first coordinate is the value on the x-axis and the second coordinate is the value of the function at that corresponding value of the first coordinate. There are multiple ways to represent the same information pictorially. The given figure is a bar graph. We can use pie charts, line graphs or histograms to represent such information as well.
Complete step by step answer:
The given graph is a bar graph. From the figure, we can see that the graph is representing a relation between subjects and marks. On the horizontal line, we see three subjects that are English, Hindi and Maths. On the vertical line, we see the marks. The height of the bars drawn for each subject show the marks for that particular subject. So, for English we have 15 marks, for Hindi we have 10 marks and for Maths we have 25 marks. The horizontal axis is the x-axis and the vertical axis is the y-axis. The x-axis and the y-axis form the xy-plane.
So, the correct answer is “Option A”.
Note: In general, a graph is a set of ordered pairs $\left( x,y \right)$ where the first coordinate is the value on the x-axis and the second coordinate is the value of the function at that corresponding value of the first coordinate. There are multiple ways to represent the same information pictorially. The given figure is a bar graph. We can use pie charts, line graphs or histograms to represent such information as well.
Recently Updated Pages
Master Class 8 English: Engaging Questions & Answers for Success
Master Class 8 Science: Engaging Questions & Answers for Success
Master Class 8 Maths: Engaging Questions & Answers for Success
Class 8 Question and Answer - Your Ultimate Solutions Guide
Master Class 8 Social Science: Engaging Questions & Answers for Success
Master Class 9 General Knowledge: Engaging Questions & Answers for Success
Trending doubts
What is BLO What is the full form of BLO class 8 social science CBSE
Citizens of India can vote at the age of A 18 years class 8 social science CBSE
Right to vote is a AFundamental Right BFundamental class 8 social science CBSE
Give me the opposite gender of Duck class 8 english CBSE
Full form of STD, ISD and PCO
Explain land use pattern in India and why has the land class 8 social science CBSE