


The graphs below show the force \[F\] acting on identical objects as a function of the distance \[d\] that the objects move. In all cases, the force and the direction of motion are along the same straight line. In which case does the force do the greatest amount of work during the interval between \[d=0\] to \[d=2\]\[m\]?
Answer
507k+ views
Hint: When attempting questions based on the \[F-s\] graph keep in mind that the area covered by the graph gives us the work done on the object by the force \[F\] and the distance \[d\] caused by the said force in order to move the object the required distance \[d\] in the given time.
Complete answer:
\[\Rightarrow \]\[(dw)=F.(ds)\]
\[\Rightarrow \int{dw=\int{F.ds}}\]
\[\Rightarrow w=\int{F.(ds)}\] Which is also equal to the Area under \[F-s\] graph.
So in order to find the graph which has the maximum amount of work done by the force in the interval of \[d=0\] to \[d=2\]\[m\] we need to find the area under the given \[F-s\] graph. The graph which has the maximum area under the graph will have the maximum amount of work and hence will be our answer.
Now let’s take out the areas under the various graphs given to us.
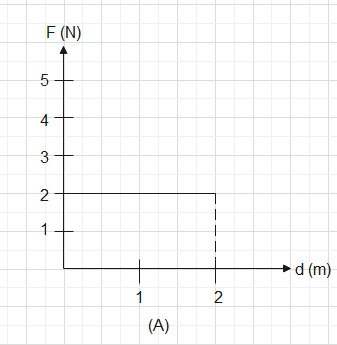
In graph (A) the figure we have is a rectangle so we have the area coming up to be
\[2\times 2\] units which is \[4uni{{t}^{2}}\]
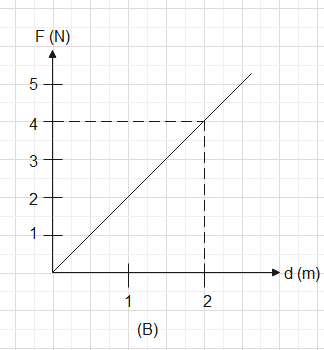
In graph (B) the figure is of a triangle so the area under the graph will be
\[\dfrac{1}{2}\times 4\times 2\] units which will also come out to be \[4uni{{t}^{2}}\]
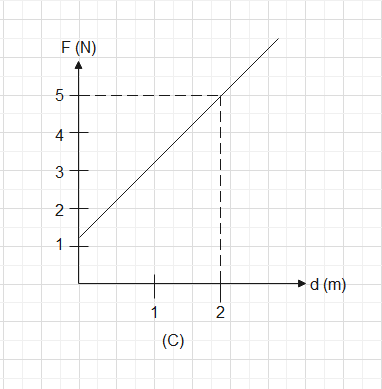
In graph (C) the area under the graph will be
\[\dfrac{1}{2}\times 2(5+1)\] units which comes out to be \[6uni{{t}^{2}}\]
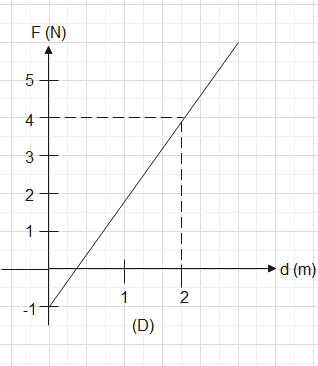
In graph (D) we also get a figure similar to triangle so the area under the given graph will come out to be
\[\dfrac{1}{2}\times 4\times 1.5\] units where in the answer comes out to be \[3uni{{t}^{2}}\]
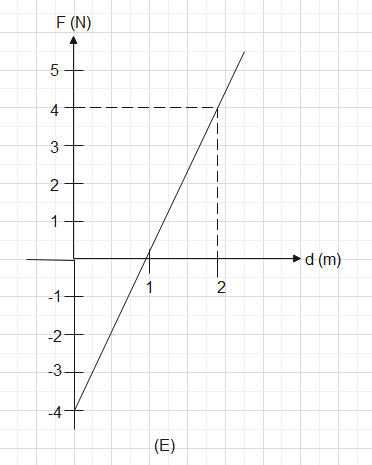
In graph (E) if we see closely we see that the graph above the \[x-axis\] is the same as below it. The values of the graph covered above are the same above and below the \[x-axis\]. Which means that the area under graph (E) comes out to be \[0uni{{t}^{2}}\].
So now from all the calculations we know graph (C) has the maximum area covered in its graph so we can conclude by saying that in Graph (C) force does the maximum work.
Hence, graph (C) is the correct answer.
Note: Area under the \[F-s\] graph gives us the value of \[Work\] which is equal to the kinetic or potential energy the object gains due to the application of the force in a given direction which enables it to gain some distance as well. Since we know \[Work\] is a dot product of force and displacement, it is a scalar quantity.
Complete answer:
\[\Rightarrow \]\[(dw)=F.(ds)\]
\[\Rightarrow \int{dw=\int{F.ds}}\]
\[\Rightarrow w=\int{F.(ds)}\] Which is also equal to the Area under \[F-s\] graph.
So in order to find the graph which has the maximum amount of work done by the force in the interval of \[d=0\] to \[d=2\]\[m\] we need to find the area under the given \[F-s\] graph. The graph which has the maximum area under the graph will have the maximum amount of work and hence will be our answer.
Now let’s take out the areas under the various graphs given to us.
In graph (A) the figure we have is a rectangle so we have the area coming up to be
\[2\times 2\] units which is \[4uni{{t}^{2}}\]
In graph (B) the figure is of a triangle so the area under the graph will be
\[\dfrac{1}{2}\times 4\times 2\] units which will also come out to be \[4uni{{t}^{2}}\]
In graph (C) the area under the graph will be
\[\dfrac{1}{2}\times 2(5+1)\] units which comes out to be \[6uni{{t}^{2}}\]
In graph (D) we also get a figure similar to triangle so the area under the given graph will come out to be
\[\dfrac{1}{2}\times 4\times 1.5\] units where in the answer comes out to be \[3uni{{t}^{2}}\]
In graph (E) if we see closely we see that the graph above the \[x-axis\] is the same as below it. The values of the graph covered above are the same above and below the \[x-axis\]. Which means that the area under graph (E) comes out to be \[0uni{{t}^{2}}\].
So now from all the calculations we know graph (C) has the maximum area covered in its graph so we can conclude by saying that in Graph (C) force does the maximum work.
Hence, graph (C) is the correct answer.
Note: Area under the \[F-s\] graph gives us the value of \[Work\] which is equal to the kinetic or potential energy the object gains due to the application of the force in a given direction which enables it to gain some distance as well. Since we know \[Work\] is a dot product of force and displacement, it is a scalar quantity.
Recently Updated Pages
Master Class 11 Computer Science: Engaging Questions & Answers for Success
Master Class 11 Business Studies: Engaging Questions & Answers for Success
Master Class 11 Economics: Engaging Questions & Answers for Success
Master Class 11 English: Engaging Questions & Answers for Success
Master Class 11 Maths: Engaging Questions & Answers for Success
Master Class 11 Biology: Engaging Questions & Answers for Success
Trending doubts
One Metric ton is equal to kg A 10000 B 1000 C 100 class 11 physics CBSE
There are 720 permutations of the digits 1 2 3 4 5 class 11 maths CBSE
Discuss the various forms of bacteria class 11 biology CBSE
Draw a diagram of a plant cell and label at least eight class 11 biology CBSE
State the laws of reflection of light
Explain zero factorial class 11 maths CBSE