


The graphs at constant pressure are called isobars.
A. True
B. False
Answer
497.4k+ views
Hint: In thermodynamics, the state of a system is defined by various thermodynamic variables such as pressure, volume, Temperature, Number of moles of any substance and various relations are studied between these properties. We will discuss the graphing of these parameters and their names as used in Thermodynamics.
Complete answer:
When various graphs are drawn between thermodynamic parameters. For example, there can be various graphs between pressure and volume of a system but let us draw the state when pressure is being constant and also a graph where volume remains constant as shown in the diagram.
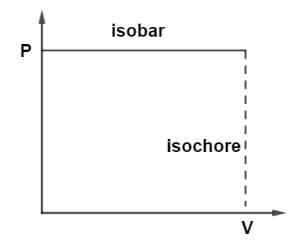
So, when pressure is kept constant on vertical Y axis then it will be a straight line parallel to horizontal X axis and these straight lines on PV diagram whenever pressure is kept constant these lines are known as isobars whereas, if we draw a graph where volume at horizontal X axis kept constant then it will be a straight line parallel to vertical axis and this line is known as Isochore. at constant volume of the system. So, the graphs drawn at constant pressure are known as Isobars.
Hence, the correct option is A.
Note: It should be remembered that, not only on the $PV$ diagrams we can draw on any relationship like pressure versus temperature, pressure versus number of moles of the system but basic line is the graph lines which are drawn at constant pressure irrespective of other variable, these graphs are called Isobars and also the graphs which are drawn at constant volume is called Isotherms.
Complete answer:
When various graphs are drawn between thermodynamic parameters. For example, there can be various graphs between pressure and volume of a system but let us draw the state when pressure is being constant and also a graph where volume remains constant as shown in the diagram.
So, when pressure is kept constant on vertical Y axis then it will be a straight line parallel to horizontal X axis and these straight lines on PV diagram whenever pressure is kept constant these lines are known as isobars whereas, if we draw a graph where volume at horizontal X axis kept constant then it will be a straight line parallel to vertical axis and this line is known as Isochore. at constant volume of the system. So, the graphs drawn at constant pressure are known as Isobars.
Hence, the correct option is A.
Note: It should be remembered that, not only on the $PV$ diagrams we can draw on any relationship like pressure versus temperature, pressure versus number of moles of the system but basic line is the graph lines which are drawn at constant pressure irrespective of other variable, these graphs are called Isobars and also the graphs which are drawn at constant volume is called Isotherms.
Recently Updated Pages
Master Class 11 Computer Science: Engaging Questions & Answers for Success
Master Class 11 Business Studies: Engaging Questions & Answers for Success
Master Class 11 Economics: Engaging Questions & Answers for Success
Master Class 11 English: Engaging Questions & Answers for Success
Master Class 11 Maths: Engaging Questions & Answers for Success
Master Class 11 Biology: Engaging Questions & Answers for Success
Trending doubts
One Metric ton is equal to kg A 10000 B 1000 C 100 class 11 physics CBSE
There are 720 permutations of the digits 1 2 3 4 5 class 11 maths CBSE
Discuss the various forms of bacteria class 11 biology CBSE
Draw a diagram of a plant cell and label at least eight class 11 biology CBSE
State the laws of reflection of light
Explain zero factorial class 11 maths CBSE