


The graph which represents the relation between refractive index $\mu $ with wavelength $\lambda $ is:
A.
B.
C.
D.
Answer
653.4k+ views
Hint: Before looking at the graphs, find the mathematical relation between $\mu $ and $\lambda $. Find the meaning of the refractive index and its formula. You should know the relation between speed, frequency and wavelength of a wave.
Formula used:
$v=\lambda f$
$\mu =\dfrac{c}{v}$
Complete step-by-step answer:
Speed of light is different in different mediums. If a ray of light passes from one medium to another, the speed of light changes. The medium in which the speed of light is faster is called the rarer medium and the medium in which the speed of light is slower is called denser medium. When the speed of light changes, it also changes its direction and the light appears to be bending at the interface of the mediums. This bending of light is called refraction.
To understand the speed of light in a medium, we have something known as a refractive index. Refractive index ($\mu $) of a medium is that characteristic which decides the speed of light. It is defined as the ratio of the speed of light in vacuum (c) to the speed of light (v) in the given medium i.e. $\mu =\dfrac{c}{v}$ ……(i).
Since light is a wave, it has a frequency and a wavelength. If you have studied about waves, then you may know that speed of a wave (v) is equal to the product of frequency (f) and wavelength ($\lambda $) of the wave i.e. $v=\lambda f$ ….….(ii)
Substitute the value of v in equation (i).
Therefore, $\mu =\dfrac{c}{f\lambda }$ ……(iii).
When a wave (light) travels through different mediums, the frequency of the wave does not change. Therefore, according to equation (ii) if the speed (v) of light changes then wavelength must change.
Consider equation (iii). Since c and f are constants, $\dfrac{c}{f}$ will also be a constant. Let $\dfrac{c}{f}=k$.
Therefore, we can write equation (iii) as $\mu =\dfrac{k}{\lambda }\Rightarrow \mu \lambda =k$.
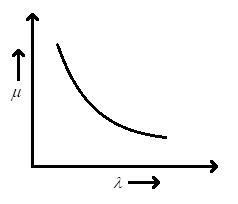
Since k is a constant, the product of $\mu $ and $\lambda $ will always be constant.
Take certain values of $\mu $ and $\lambda $. If we increase the value of $\lambda $then the value of $\mu $ decreases because the product should be constant. From here as we go on increasing the value of $\lambda $, the value of $\mu $ will go on decreasing.
If we check the graphs, the best-suited graph for the above statement is (D).
Note: Let us discuss why other graphs show incorrect relation between $\mu $ and $\lambda $.
Before going through the other three options. Let's remember the correct relation. As we continuously increase the value of $\lambda $, the value of $\mu $ decreases. This relation is throughout the graph and it does not change.
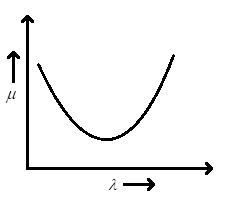
Graph A: This graph shows that if we take some values of $\mu $, $\lambda $and continuously increase the value of $\lambda $, the value of $\mu $ decreases. However, from a certain value of $\lambda $, the value of $\mu $ begins to increase. Hence, this graph does not show the correct relation.
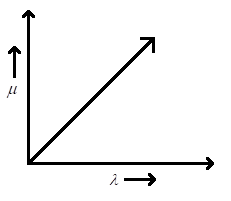
Graph B: This graph shows a uniform relation between $\mu $ and $\lambda $. For equal intervals of $\lambda $there is equal amounts of change in $\mu $. If we increase the value of $\lambda $, the value of $\mu $ increases. However, the correct relation. However, this is not the relation that we discussed before.
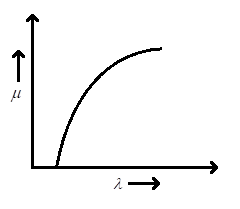
Graph C: Like in graph B, in this graph also as we increase the value of $\lambda $, the value of $\mu $ increases. However, the rate of change in $\mu $ with respect to $\lambda $ is not uniform. But even this graph does not show the correct relation between $\mu $ and $\lambda $.
Formula used:
$v=\lambda f$
$\mu =\dfrac{c}{v}$
Complete step-by-step answer:
Speed of light is different in different mediums. If a ray of light passes from one medium to another, the speed of light changes. The medium in which the speed of light is faster is called the rarer medium and the medium in which the speed of light is slower is called denser medium. When the speed of light changes, it also changes its direction and the light appears to be bending at the interface of the mediums. This bending of light is called refraction.
To understand the speed of light in a medium, we have something known as a refractive index. Refractive index ($\mu $) of a medium is that characteristic which decides the speed of light. It is defined as the ratio of the speed of light in vacuum (c) to the speed of light (v) in the given medium i.e. $\mu =\dfrac{c}{v}$ ……(i).
Since light is a wave, it has a frequency and a wavelength. If you have studied about waves, then you may know that speed of a wave (v) is equal to the product of frequency (f) and wavelength ($\lambda $) of the wave i.e. $v=\lambda f$ ….….(ii)
Substitute the value of v in equation (i).
Therefore, $\mu =\dfrac{c}{f\lambda }$ ……(iii).
When a wave (light) travels through different mediums, the frequency of the wave does not change. Therefore, according to equation (ii) if the speed (v) of light changes then wavelength must change.
Consider equation (iii). Since c and f are constants, $\dfrac{c}{f}$ will also be a constant. Let $\dfrac{c}{f}=k$.
Therefore, we can write equation (iii) as $\mu =\dfrac{k}{\lambda }\Rightarrow \mu \lambda =k$.
Since k is a constant, the product of $\mu $ and $\lambda $ will always be constant.
Take certain values of $\mu $ and $\lambda $. If we increase the value of $\lambda $then the value of $\mu $ decreases because the product should be constant. From here as we go on increasing the value of $\lambda $, the value of $\mu $ will go on decreasing.
If we check the graphs, the best-suited graph for the above statement is (D).
Note: Let us discuss why other graphs show incorrect relation between $\mu $ and $\lambda $.
Before going through the other three options. Let's remember the correct relation. As we continuously increase the value of $\lambda $, the value of $\mu $ decreases. This relation is throughout the graph and it does not change.
Graph A: This graph shows that if we take some values of $\mu $, $\lambda $and continuously increase the value of $\lambda $, the value of $\mu $ decreases. However, from a certain value of $\lambda $, the value of $\mu $ begins to increase. Hence, this graph does not show the correct relation.
Graph B: This graph shows a uniform relation between $\mu $ and $\lambda $. For equal intervals of $\lambda $there is equal amounts of change in $\mu $. If we increase the value of $\lambda $, the value of $\mu $ increases. However, the correct relation. However, this is not the relation that we discussed before.
Graph C: Like in graph B, in this graph also as we increase the value of $\lambda $, the value of $\mu $ increases. However, the rate of change in $\mu $ with respect to $\lambda $ is not uniform. But even this graph does not show the correct relation between $\mu $ and $\lambda $.
Recently Updated Pages
Basicity of sulphurous acid and sulphuric acid are
Master Class 12 Economics: Engaging Questions & Answers for Success
Master Class 12 Biology: Engaging Questions & Answers for Success
Master Class 11 English: Engaging Questions & Answers for Success
Master Class 11 Physics: Engaging Questions & Answers for Success
Master Class 11 Computer Science: Engaging Questions & Answers for Success
Trending doubts
Which are the Top 10 Largest Countries of the World?
Differentiate between homogeneous and heterogeneous class 12 chemistry CBSE
Give 10 examples of unisexual and bisexual flowers
Draw the diagram of the chloroplast class 12 biology CBSE
Lipids are insoluble in water because they are A Neutral class 12 biology CBSE
Decomposer also called as ATransducers BReducers CMicroconsumer class 12 biology CBSE