


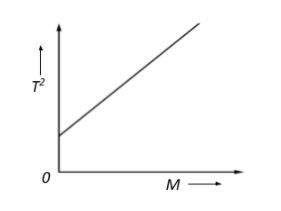
The graph shown was obtained from experimental measurements of the period of oscillation T for different masses M placed in the scale pan on a lower end of the spring balance. The most likely reason for the line not passing through the origin is that the:
A. Spring does not obey Hooke’s Law
B. Amplitude of oscillation was too large
C. Cork used needed regulating
D. Mass of the pan was neglected
Answer
542.4k+ views
Hint: Begin by first deriving the relationship between the time period of oscillation and mass. Then, determine if the graph is consistent with the relationship obtained. Check if the relationship holds for all values, including when$\;M=0$ and if not, determine where the oscillations are arising from when no mass is placed in the pan.
Formula used:
Time period of oscillation: $T = 2\pi\sqrt{\dfrac{M}{k}}$
Complete step-by-step answer:
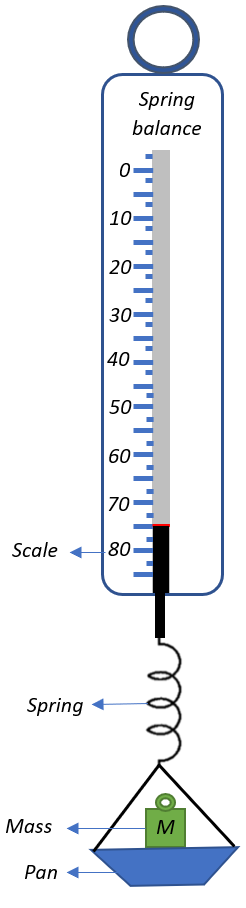
A spring balance is shown in the figure. It consists of a pan that can hold masses that need to be weighed and the pan is suspended by a spring that is attached to the scale via the reading indicator. So, when a mass is placed in the pan, it weighs down on the spring, making it oscillate for a while before coming to rest at equilibrium where the spring gets proportionally extended. The spring, in turn, pulls the reading indicator down with it, depending on the massiveness of the object placed. The scale of the spring balance is calibrated to measure the mass of the object depending on the extension of the spring.
Now, for an oscillating body such as a spring, the time period of its oscillations can be given as:
$T = 2\pi\sqrt{\dfrac{M}{k}}$, where $\;M$ is the mass causing the oscillation and $\;k$ is the spring constant that indicates the stiffness of the spring.
We are given that different masses are placed on the pan of a spring balance and their period of oscillation due to the spring is determined. This is graphically represented by the figure in the question.
Now, from the time period expression, we can obtain the relation between the time period and mass as:
$T \propto \sqrt{M} \Rightarrow T^2 \propto M$
This means that if we plot a graph between $\;T^2$ and $\;M$ it should be a straight line, indicating a linear relationship. This also means that when $M=0$, then even $T^2 = 0$ since they are directly proportional to each other.
From the graph we see that it is indeed a straight-line graph, but $T^2 \neq 0$ when $M=0$. This means that oscillations are observed even when there is no mass placed in the pan. But we know that oscillations occur only when the spring is pulled down by some mass. The only other mass that could bring about such oscillations by pulling the spring would be the pan, which is obviously of some finite mass. This means that the graph does not account for the mass of the pan for all readings obtained throughout the experiment.
Therefore, the correct option would be D. Mass of the pan was neglected.
So, the correct answer is “Option D”.
Note: Remember that the spring constant remains the same for all measurements for a given spring within its elastic limit. It is essentially the force applied if the displacement in the spring is unity. It is important to understand that force and displacement follow a linear relation, i.e., a graph between force and displacement would yield a straight line since successive increments in the force applied would produce increments in extension/compression by a common factor, which we call as the spring “constant”.
Formula used:
Time period of oscillation: $T = 2\pi\sqrt{\dfrac{M}{k}}$
Complete step-by-step answer:
A spring balance is shown in the figure. It consists of a pan that can hold masses that need to be weighed and the pan is suspended by a spring that is attached to the scale via the reading indicator. So, when a mass is placed in the pan, it weighs down on the spring, making it oscillate for a while before coming to rest at equilibrium where the spring gets proportionally extended. The spring, in turn, pulls the reading indicator down with it, depending on the massiveness of the object placed. The scale of the spring balance is calibrated to measure the mass of the object depending on the extension of the spring.
Now, for an oscillating body such as a spring, the time period of its oscillations can be given as:
$T = 2\pi\sqrt{\dfrac{M}{k}}$, where $\;M$ is the mass causing the oscillation and $\;k$ is the spring constant that indicates the stiffness of the spring.
We are given that different masses are placed on the pan of a spring balance and their period of oscillation due to the spring is determined. This is graphically represented by the figure in the question.
Now, from the time period expression, we can obtain the relation between the time period and mass as:
$T \propto \sqrt{M} \Rightarrow T^2 \propto M$
This means that if we plot a graph between $\;T^2$ and $\;M$ it should be a straight line, indicating a linear relationship. This also means that when $M=0$, then even $T^2 = 0$ since they are directly proportional to each other.
From the graph we see that it is indeed a straight-line graph, but $T^2 \neq 0$ when $M=0$. This means that oscillations are observed even when there is no mass placed in the pan. But we know that oscillations occur only when the spring is pulled down by some mass. The only other mass that could bring about such oscillations by pulling the spring would be the pan, which is obviously of some finite mass. This means that the graph does not account for the mass of the pan for all readings obtained throughout the experiment.
Therefore, the correct option would be D. Mass of the pan was neglected.
So, the correct answer is “Option D”.
Note: Remember that the spring constant remains the same for all measurements for a given spring within its elastic limit. It is essentially the force applied if the displacement in the spring is unity. It is important to understand that force and displacement follow a linear relation, i.e., a graph between force and displacement would yield a straight line since successive increments in the force applied would produce increments in extension/compression by a common factor, which we call as the spring “constant”.
Recently Updated Pages
Master Class 11 Computer Science: Engaging Questions & Answers for Success
Master Class 11 Business Studies: Engaging Questions & Answers for Success
Master Class 11 Economics: Engaging Questions & Answers for Success
Master Class 11 English: Engaging Questions & Answers for Success
Master Class 11 Maths: Engaging Questions & Answers for Success
Master Class 11 Biology: Engaging Questions & Answers for Success
Trending doubts
One Metric ton is equal to kg A 10000 B 1000 C 100 class 11 physics CBSE
There are 720 permutations of the digits 1 2 3 4 5 class 11 maths CBSE
Discuss the various forms of bacteria class 11 biology CBSE
Draw a diagram of a plant cell and label at least eight class 11 biology CBSE
State the laws of reflection of light
Explain zero factorial class 11 maths CBSE