


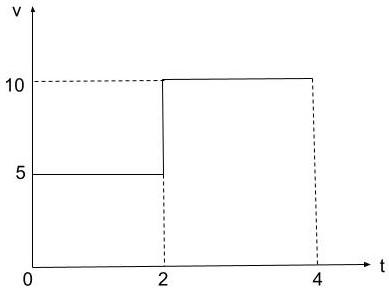
The graph represents the velocity time or the first $4$ second of the motion. Find the distance covered.
Answer
496.8k+ views
Hint: An area covered, often known as an area graph, is a graphical representation of quantitative data. A velocity-time graph depicts the speed and direction of an object over a certain time period. Speed-time graphs are sometimes known as velocity-time graphs. The velocity of the item is the vertical axis of a velocity-time graph. The time from the beginning is represented on the horizontal axis.
Complete step by step solution:
We can solve this problem by using Area under the graph.
So, from the graph we can see that the graph is divided into two parts. The first part is from $0$ to $2$ and the second part is $2$ to $4$.
So let us first calculate the area under the graph from $0$ to $2$.
Area under the rectangle $ = $ length $ \times $breadth.
$ = 2 \times 5 = 10$
Now, Let us calculate the area under the graph from $2$ to $4$.
Area under the rectangle $ = $ length $ \times $breadth.
$ = 10 \times (4 - 2) = 20$
Now, by adding both the area we can calculate the distance covered $ = 10 + 20 = 30\,m$
So, the total distance covered is $30\,m$.
Note:
The velocity is changing linearly, showing that the velocity is changing at a constant rate or there is constant acceleration, as seen in the graph above for a uniformly accelerated motion. In uniformly accelerating motion, however, the velocity time graph would be a straight line since velocity varies at a consistent rate with respect to time with acceleration.
Recently Updated Pages
Master Class 11 English: Engaging Questions & Answers for Success
Master Class 11 Maths: Engaging Questions & Answers for Success
Master Class 11 Biology: Engaging Questions & Answers for Success
Master Class 11 Social Science: Engaging Questions & Answers for Success
Master Class 11 Physics: Engaging Questions & Answers for Success
Master Class 11 Accountancy: Engaging Questions & Answers for Success
Trending doubts
One Metric ton is equal to kg A 10000 B 1000 C 100 class 11 physics CBSE
Discuss the various forms of bacteria class 11 biology CBSE
Draw a diagram of a plant cell and label at least eight class 11 biology CBSE
State the laws of reflection of light
Explain zero factorial class 11 maths CBSE
10 examples of friction in our daily life