


The graph of \[y = |x|\] consists of pair of straight lines lying
1) To the left of y-axis
2) Above x-axis
3) Below y-axis
4) To the right of y-axis
Answer
526.2k+ views
Hint: We are given an equation \[y = |x|\] and we need to find the graph of this equation. First, we will remove the mod sign of x, so we get two values of y. Then, we will substitute the values of x to get the values of y. And then, these values are used to plot the graph and thus, we get our final output.
Graphing is always about actually plotting the points to obtain a representative diagram.
Complete answer:
Given that, the equation \[y = |x|\].
We know that,
The graph of the equation y = a, is always a straight line parallel to x-axis.
We need to find the graph of the given equation.
First we will remove the mod sign of x, then
\[y = x,{\text{ }}x > 0\] and \[y = - x,{\text{ }}x < 0\]
Let's substitute the value of x to get the value of y and then we will plot in the graph.
For, the equation \[y = x\]
When \[x = 0,{\text{ }}y = 0\]
\[x = 1,{\text{ }}y = 1\]
\[x = 2,{\text{ }}y = 2\]
\[x = 3,{\text{ }}y = 3\]and so on…
Thus, we get positive values of y, when \[x > 0\].
Next, for the equation \[y = - x\]
When \[x = - 1,{\text{ }}y = - 1\]
\[x = - 2,{\text{ }}y = - 2\]
\[x = - 3,{\text{ }}y = - 3\] and so on…
Thus, we get negative values of y, when \[x < 0\].
Now, we will plot these points on the graph as below:
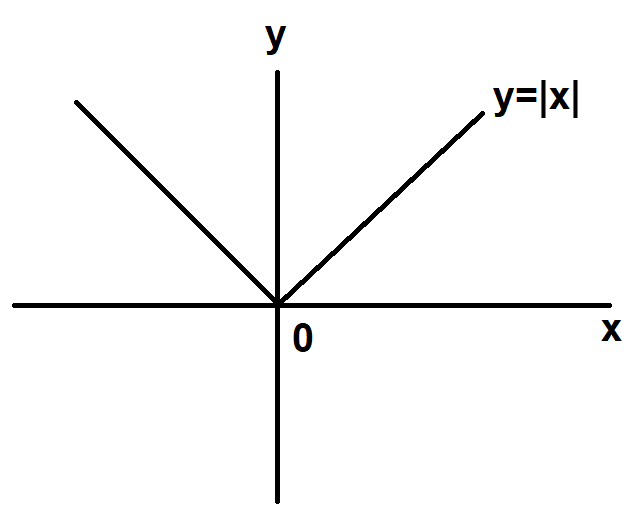
So, we get a graph which consists of a pair of straight lines lying above the x-axis.
Hence, for the given equation \[y = |x|\] we get a graph which consists of a pair of straight lines lying above the x-axis.
Note:
Linear equations, also known as first-order degree equations, where the highest power of the variable is one. When an equation has one variable, it is known as linear equations in one variable. When it has two variables, then it is called a linear equation with two variables. Every linear equation in two variables can be represented geometrically as a straight line in a coordinate plane. Points on the line are the solution of the equation. This is why equations with degree one are called linear equations.
Graphing is always about actually plotting the points to obtain a representative diagram.
Complete answer:
Given that, the equation \[y = |x|\].
We know that,
The graph of the equation y = a, is always a straight line parallel to x-axis.
We need to find the graph of the given equation.
First we will remove the mod sign of x, then
\[y = x,{\text{ }}x > 0\] and \[y = - x,{\text{ }}x < 0\]
Let's substitute the value of x to get the value of y and then we will plot in the graph.
For, the equation \[y = x\]
When \[x = 0,{\text{ }}y = 0\]
\[x = 1,{\text{ }}y = 1\]
\[x = 2,{\text{ }}y = 2\]
\[x = 3,{\text{ }}y = 3\]and so on…
Thus, we get positive values of y, when \[x > 0\].
Next, for the equation \[y = - x\]
When \[x = - 1,{\text{ }}y = - 1\]
\[x = - 2,{\text{ }}y = - 2\]
\[x = - 3,{\text{ }}y = - 3\] and so on…
Thus, we get negative values of y, when \[x < 0\].
Now, we will plot these points on the graph as below:
So, we get a graph which consists of a pair of straight lines lying above the x-axis.
Hence, for the given equation \[y = |x|\] we get a graph which consists of a pair of straight lines lying above the x-axis.
Note:
Linear equations, also known as first-order degree equations, where the highest power of the variable is one. When an equation has one variable, it is known as linear equations in one variable. When it has two variables, then it is called a linear equation with two variables. Every linear equation in two variables can be represented geometrically as a straight line in a coordinate plane. Points on the line are the solution of the equation. This is why equations with degree one are called linear equations.
Recently Updated Pages
Master Class 11 Social Science: Engaging Questions & Answers for Success
Master Class 11 English: Engaging Questions & Answers for Success
Master Class 11 Maths: Engaging Questions & Answers for Success
Master Class 11 Chemistry: Engaging Questions & Answers for Success
Master Class 11 Biology: Engaging Questions & Answers for Success
Master Class 11 Physics: Engaging Questions & Answers for Success
Trending doubts
Differentiate between an exothermic and an endothermic class 11 chemistry CBSE
One Metric ton is equal to kg A 10000 B 1000 C 100 class 11 physics CBSE
Difference Between Prokaryotic Cells and Eukaryotic Cells
There are 720 permutations of the digits 1 2 3 4 5 class 11 maths CBSE
Two of the body parts which do not appear in MRI are class 11 biology CBSE
Which gas is abundant in air class 11 chemistry CBSE