


The following table shows the number of illiterate persons in the age group (10–58 years) in a town. Represent the given data by means of a histogram. \[\]
Age group (In years) 10-18 18-26 26-34 34-42 42-50 50-56 Number of an illiterate person 175 325 100 150 250 525
| Age group (In years) | 10-18 | 18-26 | 26-34 | 34-42 | 42-50 | 50-56 |
| Number of an illiterate person | 175 | 325 | 100 | 150 | 250 | 525 |
Answer
601.2k+ views
Hint: We find the width of each bin number of illiterate by subtracting the lower limit of the bin from the upper limit as 8. The frequency is the number of students in each bin which are 175, 325, 100, 150, 250, and 525. We draw vertical bars with the width equal to the width of the bins and the height equal to the corresponding frequency of the bin.
Complete step-by-step solution:
We know that histogram is an approximate representation of the distribution of numerical data. We need a range of values called bins or intervals and the number of items that fall into a particular bin also called frequency. The bins have to be continuous, non-overlapping and most of the time equal.
The histogram consists of adjacent vertical rectangular bars on the horizontal axis whose width is proportional to the width of the bin and height is proportional to the corresponding frequency of the bin frequencies. \[\]
Let us observe the given table of the number of illiterate persons in the age group (10–58 years) in a town from the question. \[\]
We are given 6 bins of ages and their corresponding frequencies as the number of illiterate persons. We see that the bins are of equal width and the width are of the size $18-10=26-18=34-26=42-34=50-42=58-50=8$ \[\]
Let us draw the first rectangular bar for the bin 10-18 whose width is 8 and its frequency is 175 which will be the height of the bar. So we have figured as \[\]
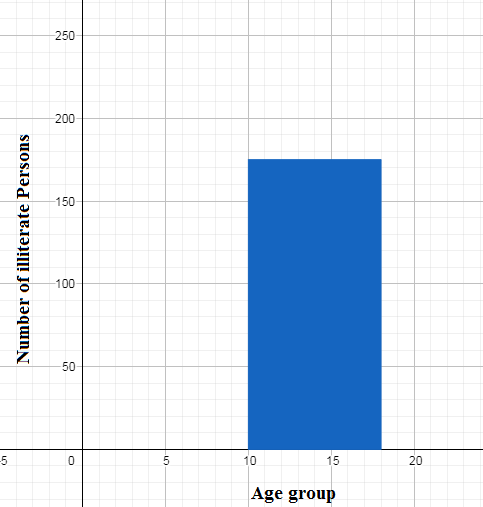
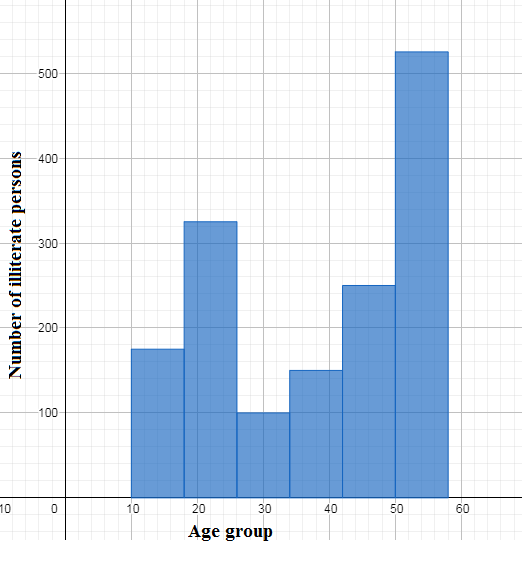
We similarly draw for the rest of the bins 18-26, 26-34, 34-42,42-50, and 50-58 the corresponding proportional heights as 325, 100, 150, 250, and 525 respectively. We draw adjacent rectangular bars starting 18-26 in the next step. We have the required histogram as
Note: We note that in our histogram we have taken in horizontal axis 1 small division representing 20 illiterate persons. We note that it is not the height but the area of the rectangular bars (width $\times $ height) that represents how much frequency is distributed within the bin. We must be careful of the confusion between histogram and bar chart. The histogram is a type of bar chart where the frequency is distributed over continuous bins as vertical bars but bar charts can also take discontinuous categories and also can be horizontal bars.
Complete step-by-step solution:
We know that histogram is an approximate representation of the distribution of numerical data. We need a range of values called bins or intervals and the number of items that fall into a particular bin also called frequency. The bins have to be continuous, non-overlapping and most of the time equal.
The histogram consists of adjacent vertical rectangular bars on the horizontal axis whose width is proportional to the width of the bin and height is proportional to the corresponding frequency of the bin frequencies. \[\]
Let us observe the given table of the number of illiterate persons in the age group (10–58 years) in a town from the question. \[\]
| Bins: Age group(in years ) | Frequency: Number of an illiterate person |
| 10-18 | 175 |
| 18-26 | 325 |
| 26-34 | 100 |
| 34-42 | 150 |
| 42-50 | 250 |
| 50-58 | 525 |
We are given 6 bins of ages and their corresponding frequencies as the number of illiterate persons. We see that the bins are of equal width and the width are of the size $18-10=26-18=34-26=42-34=50-42=58-50=8$ \[\]
Let us draw the first rectangular bar for the bin 10-18 whose width is 8 and its frequency is 175 which will be the height of the bar. So we have figured as \[\]
We similarly draw for the rest of the bins 18-26, 26-34, 34-42,42-50, and 50-58 the corresponding proportional heights as 325, 100, 150, 250, and 525 respectively. We draw adjacent rectangular bars starting 18-26 in the next step. We have the required histogram as
Note: We note that in our histogram we have taken in horizontal axis 1 small division representing 20 illiterate persons. We note that it is not the height but the area of the rectangular bars (width $\times $ height) that represents how much frequency is distributed within the bin. We must be careful of the confusion between histogram and bar chart. The histogram is a type of bar chart where the frequency is distributed over continuous bins as vertical bars but bar charts can also take discontinuous categories and also can be horizontal bars.
Recently Updated Pages
Master Class 12 Economics: Engaging Questions & Answers for Success
Master Class 12 English: Engaging Questions & Answers for Success
Master Class 12 Social Science: Engaging Questions & Answers for Success
Master Class 12 Maths: Engaging Questions & Answers for Success
Master Class 12 Physics: Engaging Questions & Answers for Success
Master Class 9 General Knowledge: Engaging Questions & Answers for Success
Trending doubts
Find the sum of series 1 + 2 + 3 + 4 + 5 + + 100 class 9 maths CBSE
Difference Between Plant Cell and Animal Cell
Fill the blanks with the suitable prepositions 1 The class 9 english CBSE
What is pollution? How many types of pollution? Define it
Name 10 Living and Non living things class 9 biology CBSE
What is the full form of pH?