


The following table shows the favourite games of 40 students in a class.
Games Cricket Football Hockey Basketball No. of Students 20 10 5 5
Represent the data using a circle graph.
| Games | Cricket | Football | Hockey | Basketball |
| No. of Students | 20 | 10 | 5 | 5 |
Answer
626.1k+ views
Hint: First find the angle occupied by each game and then draw the graph.
Here, ${\theta _C},{\theta _F},{\theta _H},{\theta _B}$ are the angles occupied by Cricket, Football, Hockey and Basketball respectively.
$\theta $ is the angle, which is used to draw the graph.
Complete step-by-step answer:
To find the $\theta $ we can use this formula.
$\theta = \dfrac{{{\text{Given}}\;{\text{Quantity}}}}{{{\text{Total}}\;{\text{Quantity}}}} \times 360^\circ $
Here, the given quantity is the number of students playing each game.
Total quantity is the total no of students and $360^\circ $ is the total angle of a circle.
According to the question:
Total no of students = 40.
No. of students who play Cricket = 20.
No. of students who play Football = 10.
No. of students who play Hockey = 5
No. of students who play Basketball = 5
Now, we need to find the angle subtended by each game on the circle.
$\therefore $ angle subtended by cricket = ${\theta _c}$
${\theta _c} = \dfrac{{{2}{0}}}{{{4}{0}}} \times 360^\circ = 180$
$\therefore $ angle subtended by football = $\theta r$
${\theta _F} = \dfrac{{1{0}}}{{4{0}}} \times 360^\circ = 90^\circ $
$\therefore $ angle subtended by Hockey = \[{\theta _H}\]
\[{\theta _H} = \dfrac{5}{{{4}{0}}} \times \mathop {{3}{6}0} = 45^\circ \]
$\therefore $ angle subtended by Basketball = ${\theta _B}$
\[{\theta _B} = \dfrac{5}{{{4}{0}}} \times \mathop {{3}{6}0}= 45^\circ \]
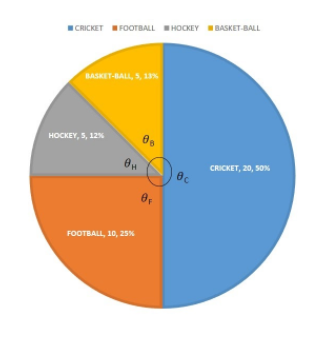
So now, we have all the data required to draw a circle graph.
$\therefore $ the graph will be like
${\theta _C}$ = Cricket
${\theta _F}$ = Football
${\theta _H}$ = Hockey
${\theta _B}$ = Basketball
Note: In the question where the graph is required to draw.
We will 1st process the data. Also we could have made this by finding the percentage covered by each game.
Like the area covered by cricket = Ac.
Ac \[ = \dfrac{{{2}{0}}}{{4{0}}} \times \mathop {1{0}{0}} = 50\% \] area.
Similarly
AF = $\dfrac{{1{0}}}{{4{0}}} \times 100 = 25\% $ area.
AH = $\dfrac{5}{{\mathop {{4}{0}}\limits_2 }} \times \mathop {{1}{0}{0}} = \dfrac{{25}}{2} = 12.5\% $. area
AB = $\dfrac{5}{{40}} \times 100 = 12.5\% $ area
Here, ${\theta _C},{\theta _F},{\theta _H},{\theta _B}$ are the angles occupied by Cricket, Football, Hockey and Basketball respectively.
$\theta $ is the angle, which is used to draw the graph.
Complete step-by-step answer:
To find the $\theta $ we can use this formula.
$\theta = \dfrac{{{\text{Given}}\;{\text{Quantity}}}}{{{\text{Total}}\;{\text{Quantity}}}} \times 360^\circ $
Here, the given quantity is the number of students playing each game.
Total quantity is the total no of students and $360^\circ $ is the total angle of a circle.
According to the question:
Total no of students = 40.
No. of students who play Cricket = 20.
No. of students who play Football = 10.
No. of students who play Hockey = 5
No. of students who play Basketball = 5
Now, we need to find the angle subtended by each game on the circle.
$\therefore $ angle subtended by cricket = ${\theta _c}$
${\theta _c} = \dfrac{{{2}{0}}}{{{4}{0}}} \times 360^\circ = 180$
$\therefore $ angle subtended by football = $\theta r$
${\theta _F} = \dfrac{{1{0}}}{{4{0}}} \times 360^\circ = 90^\circ $
$\therefore $ angle subtended by Hockey = \[{\theta _H}\]
\[{\theta _H} = \dfrac{5}{{{4}{0}}} \times \mathop {{3}{6}0} = 45^\circ \]
$\therefore $ angle subtended by Basketball = ${\theta _B}$
\[{\theta _B} = \dfrac{5}{{{4}{0}}} \times \mathop {{3}{6}0}= 45^\circ \]
So now, we have all the data required to draw a circle graph.
$\therefore $ the graph will be like
${\theta _C}$ = Cricket
${\theta _F}$ = Football
${\theta _H}$ = Hockey
${\theta _B}$ = Basketball
Note: In the question where the graph is required to draw.
We will 1st process the data. Also we could have made this by finding the percentage covered by each game.
Like the area covered by cricket = Ac.
Ac \[ = \dfrac{{{2}{0}}}{{4{0}}} \times \mathop {1{0}{0}} = 50\% \] area.
Similarly
AF = $\dfrac{{1{0}}}{{4{0}}} \times 100 = 25\% $ area.
AH = $\dfrac{5}{{\mathop {{4}{0}}\limits_2 }} \times \mathop {{1}{0}{0}} = \dfrac{{25}}{2} = 12.5\% $. area
AB = $\dfrac{5}{{40}} \times 100 = 12.5\% $ area
Recently Updated Pages
Master Class 12 Economics: Engaging Questions & Answers for Success
Master Class 12 English: Engaging Questions & Answers for Success
Master Class 12 Social Science: Engaging Questions & Answers for Success
Master Class 12 Maths: Engaging Questions & Answers for Success
Master Class 12 Physics: Engaging Questions & Answers for Success
Master Class 8 English: Engaging Questions & Answers for Success
Trending doubts
What is BLO What is the full form of BLO class 8 social science CBSE
Which Indian state shares the longest international class 8 social science CBSE
What are the 12 elements of nature class 8 chemistry CBSE
Citizens of India can vote at the age of A 18 years class 8 social science CBSE
Right to vote is a AFundamental Right BFundamental class 8 social science CBSE
Full form of STD, ISD and PCO