


The following table gives production yield per hectare of wheat of 100 farms of a village.
Production yield in (kg\hectare) 50-55 55-60 60-65 65-70 70-75 75-80 Number of farms 2 8 12 24 38 16
Change the distribution to a more than type distribution, and draw its ogive.
| Production yield in (kg\hectare) | 50-55 | 55-60 | 60-65 | 65-70 | 70-75 | 75-80 |
| Number of farms | 2 | 8 | 12 | 24 | 38 | 16 |
Answer
590.7k+ views
Hint: The graphs of the frequency distribution are frequency graphs that are used to exhibit the characteristics of discrete and continuous data. Such figures are the most appealing and attractive to the eye than the tabulated data. It helps us to facilitate the comparative study of two or more frequency distributions. Similarly, we can relate the shape and pattern of the two frequency distributions.
Complete step-by -step solution:
The Ogive is defined as the frequency distribution graph of the series. The Ogive is a graph of the cumulative distribution, which explains the data values on the horizontal plane axis and either the cumulative relative frequencies, the cumulative frequencies or cumulative percent frequencies on the vertical axis.
First, we have to convert the give distribution to More than cumulative frequency distribution as:
Now, let us draw the ogive by plotting the points (50,100), (55,98), (60,90),(65,78),(70,54) and (75,16) on this graph paper and join them by the free hand smooth curve.
Note:Cumulative frequency is defined as the sum of all the previous frequencies up to the current point. To find the popularity of the given data or the likelihood of the data that fall within the certain frequency range, Ogive curve helps in finding those details accurately. Create the Ogive by plotting the point corresponding to the cumulative frequency of each class interval. Ogive curve is used by most of the Statisticians, to illustrate the data in the pictorial representation. It helps in estimating the number of observations which are less than or equal to the particular value.
Complete step-by -step solution:
The Ogive is defined as the frequency distribution graph of the series. The Ogive is a graph of the cumulative distribution, which explains the data values on the horizontal plane axis and either the cumulative relative frequencies, the cumulative frequencies or cumulative percent frequencies on the vertical axis.
First, we have to convert the give distribution to More than cumulative frequency distribution as:
| Production Yield (in kg/hectare) | Number of farms |
| >50 | 100 |
| >55 | 100-2=98 |
| >60 | 98-8=90 |
| >65 | 90-12=78 |
| >70 | 78-24=54 |
| >75 | 54-38=16 |
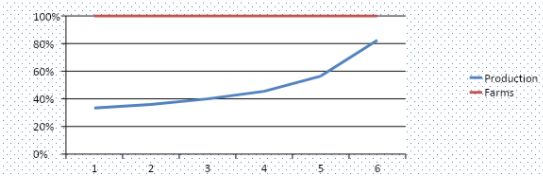
Now, let us draw the ogive by plotting the points (50,100), (55,98), (60,90),(65,78),(70,54) and (75,16) on this graph paper and join them by the free hand smooth curve.
Note:Cumulative frequency is defined as the sum of all the previous frequencies up to the current point. To find the popularity of the given data or the likelihood of the data that fall within the certain frequency range, Ogive curve helps in finding those details accurately. Create the Ogive by plotting the point corresponding to the cumulative frequency of each class interval. Ogive curve is used by most of the Statisticians, to illustrate the data in the pictorial representation. It helps in estimating the number of observations which are less than or equal to the particular value.
Recently Updated Pages
Master Class 10 Computer Science: Engaging Questions & Answers for Success
Master Class 10 General Knowledge: Engaging Questions & Answers for Success
Master Class 10 English: Engaging Questions & Answers for Success
Master Class 10 Social Science: Engaging Questions & Answers for Success
Master Class 10 Maths: Engaging Questions & Answers for Success
Master Class 10 Science: Engaging Questions & Answers for Success
Trending doubts
What is the median of the first 10 natural numbers class 10 maths CBSE
Which women's tennis player has 24 Grand Slam singles titles?
Who is the Brand Ambassador of Incredible India?
Why is there a time difference of about 5 hours between class 10 social science CBSE
Write a letter to the principal requesting him to grant class 10 english CBSE
A moving boat is observed from the top of a 150 m high class 10 maths CBSE