


The following distribution gives the daily income of 50 workers in a factory.
Daily income (in Rs.) No. of workers 100-120 12 120-140 14 140-160 8 160-180 6 180-200 10
Convert the distribution above to a less than type cumulative frequency distribution and draw its ogive.
| Daily income (in Rs.) | No. of workers |
| 100-120 | 12 |
| 120-140 | 14 |
| 140-160 | 8 |
| 160-180 | 6 |
| 180-200 | 10 |
Answer
608.1k+ views
Hint: We start solving the problem by recalling the definition of less than type cumulative frequency as the frequency of all the values less than the upper limit of the given class interval. We then add the frequencies which were less than the upper limit of the given class interval. We then make the calculations required to find the cumulative frequencies and draw the plot between the upper limit of class intervals of Daily income and cumulative frequencies.
Complete step-by-step solution:
According to the problem, we are given the daily income of 50 workers in a factory in the following distribution.
We need to convert this distribution to a less than type cumulative frequency distribution and draw its ogive.
We know that the less than type cumulative distribution is calculated by considering all the values less than the upper limit of the given class interval.
So, let us first write the cumulative frequency for the no. of workers.
Now, let us draw the plot between the Upper limit of the class interval of Daily income and less than type cumulative frequency (which is also called ogive).
So, the ogive is as shown below:
Note: We should know that ogive of less than cumulative frequency type is drawn between the upper boundary of class interval and cumulative frequencies. While the ogive of greater than cumulative frequency type is drawn between the lower boundary of class interval and cumulative frequencies. We know that these ogives play an important role while calculating the median of the given frequency distribution. Similarly, we can expect problems to draw the ogive for greater than type cumulative frequencies.
Complete step-by-step solution:
According to the problem, we are given the daily income of 50 workers in a factory in the following distribution.
| Daily income (in Rs.) | No. of workers |
| 100-120 | 12 |
| 120-140 | 14 |
| 140-160 | 8 |
| 160-180 | 6 |
| 180-200 | 10 |
We need to convert this distribution to a less than type cumulative frequency distribution and draw its ogive.
We know that the less than type cumulative distribution is calculated by considering all the values less than the upper limit of the given class interval.
So, let us first write the cumulative frequency for the no. of workers.
| Daily income (in Rs.) | Less than type cumulative frequency |
| Less than 120 | 12 |
| Less than 140 | 12+14=26 |
| Less than 160 | 12+14+8=34 |
| Less than 180 | 12+14+8+6=40 |
| Less than 200 | 12+14+8+6+10=50 |
| Daily income (in Rs.) | Less than type cumulative frequency |
| Less than 120 | 12 |
| Less than 140 | 26 |
| Less than 160 | 34 |
| Less than 180 | 40 |
| Less than 200 | 50 |
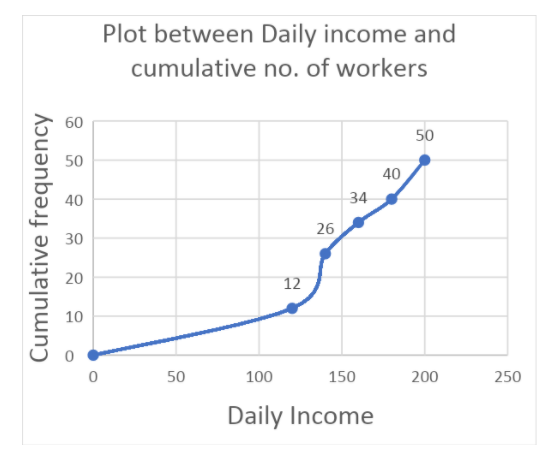
Now, let us draw the plot between the Upper limit of the class interval of Daily income and less than type cumulative frequency (which is also called ogive).
So, the ogive is as shown below:
Note: We should know that ogive of less than cumulative frequency type is drawn between the upper boundary of class interval and cumulative frequencies. While the ogive of greater than cumulative frequency type is drawn between the lower boundary of class interval and cumulative frequencies. We know that these ogives play an important role while calculating the median of the given frequency distribution. Similarly, we can expect problems to draw the ogive for greater than type cumulative frequencies.
Recently Updated Pages
Master Class 10 English: Engaging Questions & Answers for Success
Master Class 10 Social Science: Engaging Questions & Answers for Success
Master Class 10 Computer Science: Engaging Questions & Answers for Success
Class 10 Question and Answer - Your Ultimate Solutions Guide
Master Class 10 General Knowledge: Engaging Questions & Answers for Success
Master Class 10 Maths: Engaging Questions & Answers for Success
Trending doubts
Explain the Treaty of Vienna of 1815 class 10 social science CBSE
Who Won 36 Oscar Awards? Record Holder Revealed
What is the median of the first 10 natural numbers class 10 maths CBSE
Why is it 530 pm in india when it is 1200 afternoon class 10 social science CBSE
Define Potential, Developed, Stock and Reserved resources
Fill the blanks with proper collective nouns 1 A of class 10 english CBSE