


The following data on the number of girls (to the nearest tens) per thousand boys in different sections of Indian Society is given below
i) Represent the information above by a bar graph.
ii) In the classroom discuss what conclusions can be arrived at from the graph.
Section Number of girls per thousand boys Scheduled Costa (SC) 940 Scheduled Tribe(ST) 970 Non SC/ST 920 Backward districts 950 Non-backward districts 920 Rural 930 Urban 910
| Section | Number of girls per thousand boys |
| Scheduled Costa (SC) | 940 |
| Scheduled Tribe(ST) | 970 |
| Non SC/ST | 920 |
| Backward districts | 950 |
| Non-backward districts | 920 |
| Rural | 930 |
| Urban | 910 |
Answer
609.9k+ views
Hint: We shall first draw the axis of our bar graph. Let’s choose x-axis to be “sections” and y-axis to be “number of girls per 1000 boys". Later for the second part of the question, let’s compare each bar with each other and write the conclusion.
Complete step-by-step answer:
Bar graphs can be used to show how something changes over time or to compare items. They have an x-axis (horizontal) and a y-axis (vertical). Typically, the x-axis has numbers for the time period or what is being measured, and the y-axis has numbers for the amount of stuff being measured.
We choose Y-axis to be the number of girls / 1000 boys & we choose the points to start from 900 to 980, as our values lie in this range. We choose x-axis to be sections, and based on the data given draw the bars up to the respective value.
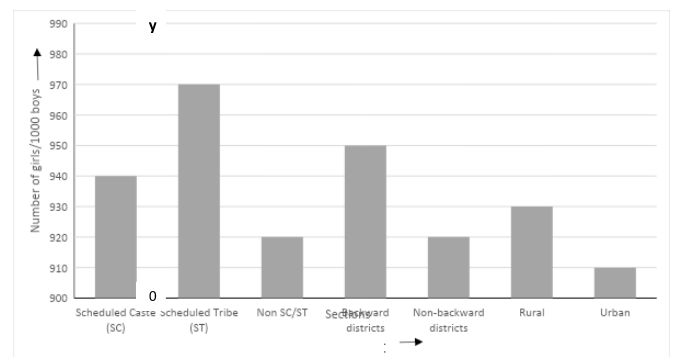
The above graph represents the various section girls per 1000 boys.
Conclusion :- From the above graph, we can come to the final conclusion as mentioned below
A.Maximum number of girls belong to ST.
B.Minimum number of girls belong to urban.
C.Number of ST > Number of SC
D.Number of backward districts > Number of non-backward districts.
E.Number of rural > Number of urban.
Note: Choose the x-axis and y-axis appropriately while drawing the bar graph. Choose the points on the y-axis based on the values given in the table. Draw the graph carefully and analyse the given data & write the conclusions.
Complete step-by-step answer:
Bar graphs can be used to show how something changes over time or to compare items. They have an x-axis (horizontal) and a y-axis (vertical). Typically, the x-axis has numbers for the time period or what is being measured, and the y-axis has numbers for the amount of stuff being measured.
We choose Y-axis to be the number of girls / 1000 boys & we choose the points to start from 900 to 980, as our values lie in this range. We choose x-axis to be sections, and based on the data given draw the bars up to the respective value.
The above graph represents the various section girls per 1000 boys.
Conclusion :- From the above graph, we can come to the final conclusion as mentioned below
A.Maximum number of girls belong to ST.
B.Minimum number of girls belong to urban.
C.Number of ST > Number of SC
D.Number of backward districts > Number of non-backward districts.
E.Number of rural > Number of urban.
Note: Choose the x-axis and y-axis appropriately while drawing the bar graph. Choose the points on the y-axis based on the values given in the table. Draw the graph carefully and analyse the given data & write the conclusions.
Recently Updated Pages
Three beakers labelled as A B and C each containing 25 mL of water were taken A small amount of NaOH anhydrous CuSO4 and NaCl were added to the beakers A B and C respectively It was observed that there was an increase in the temperature of the solutions contained in beakers A and B whereas in case of beaker C the temperature of the solution falls Which one of the following statements isarecorrect i In beakers A and B exothermic process has occurred ii In beakers A and B endothermic process has occurred iii In beaker C exothermic process has occurred iv In beaker C endothermic process has occurred
Master Class 8 Social Science: Engaging Questions & Answers for Success
Master Class 8 Science: Engaging Questions & Answers for Success
Master Class 8 Maths: Engaging Questions & Answers for Success
Class 8 Question and Answer - Your Ultimate Solutions Guide
Master Class 9 Social Science: Engaging Questions & Answers for Success
Three beakers labelled as A B and C each containing 25 mL of water were taken A small amount of NaOH anhydrous CuSO4 and NaCl were added to the beakers A B and C respectively It was observed that there was an increase in the temperature of the solutions contained in beakers A and B whereas in case of beaker C the temperature of the solution falls Which one of the following statements isarecorrect i In beakers A and B exothermic process has occurred ii In beakers A and B endothermic process has occurred iii In beaker C exothermic process has occurred iv In beaker C endothermic process has occurred
Master Class 8 Social Science: Engaging Questions & Answers for Success
Master Class 8 Science: Engaging Questions & Answers for Success
Trending doubts
What is BLO What is the full form of BLO class 8 social science CBSE
Give me the opposite gender of Duck class 8 english CBSE
Name the states through which the Tropic of Cancer class 8 social science CBSE
Citizens of India can vote at the age of A 18 years class 8 social science CBSE
Advantages and disadvantages of science
Right to vote is a AFundamental Right BFundamental class 8 social science CBSE