


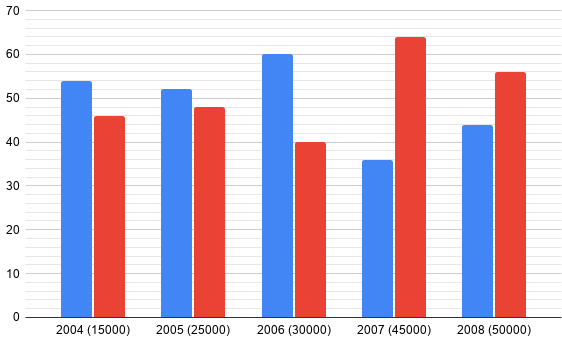
The following bar graph shows the percentage of chairs produced by two companies Neel Kamal and Raj Kamal during five different years. Bar graph also shows the total no. of chairs produced in different years associated with it. Study the graph carefully to answer the following questions:
1) Find the average no. of chairs produced by Raj Kamal in the years 2004, 2006 and 2007 together.
2) What is the ratio of no. of chairs produced by Neel Kamal in 2007 and 2008 together to that by Raj Kamal in the same years together?
3) If \[12\% \] chairs out of total chairs produced in 2008 were defective and in them ratio of defective chairs by Raj Kamal and Neel Kamal is \[2:3\] then find the no. of defective chairs produced by Neel Kamal in the year 2008.
Answer
609k+ views
Hint:
By studying the bar graph, we can easily comprehend and calculate the quantity of the chairs. We do not need to separately calculate the number of chairs of both the companies. We calculate the number of chairs produced by any one company and then to calculate the same for the other company, we just subtract the number obtained from the total number of chairs and we are going to have the other company’s number of chairs too.
Formula used:
We will use the percentage formula in the question:
\[percentage\]\[ = \dfrac{{{\text{given number of items}}}}{{{\text{total number of items}}}}\]
Complete step by step solution:
This question shows the variance of the number of the chairs produced by the two given companies, Neel Kamal and Raj Kamal, in five years of their operation, from 2004 to 2008.
Let the total number of items be \[n,\] given percentage be \[p\% ,\]and let the required number of items be \[m.\]
Then, according to the percentage formula, we have:
\[p = \dfrac{m}{n} \times 100\]
But here the unknown is \[m,\] so:
\[m = \dfrac{{p \times n}}{{100}}\]
Now, let’s write down the percentage of items produced by Raj Kamal (R), percentage of items produced by Neel Kamal (N) and the total number of given items (T) and calculate the items produced by each company:
Year 2004:
T = \[15000\], N = \[54\% \], R = \[46\% \],
n(N) = \[\dfrac{{54 \times 15000}}{{100}} = 8100\]
n(R) = T – n(N) = \[15000 - 8100 = 6900\]
Year 2005:
T = \[25000\], N = \[52\% \], R = \[48\% \], n(N) = \[13000\], n(R) = \[12000\]
Year 2006:
T = \[30000\], N = \[60\% \], R = \[40\% \], n(N) = \[18000\], n(R) = \[12000\]
Year 2007:
T = \[45000\], N = \[36\% \], R = \[64\% \], n(N) = \[16200\], n(R) = \[28800\]
Year 2008:
T = \[50000\], N = \[44\% \], R = \[56\% \], n(N) = \[22000\], n(R) = \[28000\]
Now, we can easily answer all the questions.
Average = \[\dfrac{{{\text{total number of chairs}}}}{{{\text{number of years}}}}\]
Total number of chairs = \[6900 + 12000 + 28800 = 47700\]
Thus, average = \[\dfrac{{47700}}{3} = 15900\]
Number of chairs produced by Neel Kamal in the years = \[16200 + 22000 = 38200\]
Number of chairs produced by Raj Kamal in the years = \[28800 + 28000 = 56800\]
Thus, required ratio = \[38200:56800 = 191:284\]
Total number of chairs produced in 2008 = \[50000\]
Percentage of defective chairs = \[12\% \]
So, number of defective chairs = \[12\% \]of \[50000 = \dfrac{{12}}{{100}} \times 50000 = 6000\]
Ratio of defective chairs of Raj Kamal to Neel Kamal = \[2:3\]
Thus, number of defective chairs produced by Neel Kamal = \[\dfrac{3}{{2 + 3}} \times 6000 = \dfrac{3}{5} \times 6000 = 3600\]
Note:
Hence, in solving questions like these, it is best to write down all the given data and formulae. This helps us in identifying what is needed and when is needed, without having to search over and over again. It also keeps the data well organized and easy to comprehend.
Recently Updated Pages
Master Class 8 English: Engaging Questions & Answers for Success
Master Class 8 Science: Engaging Questions & Answers for Success
Class 8 Question and Answer - Your Ultimate Solutions Guide
Master Class 8 Maths: Engaging Questions & Answers for Success
Master Class 8 Social Science: Engaging Questions & Answers for Success
Master Class 5 English: Engaging Questions & Answers for Success
Trending doubts
In Indian rupees 1 trillion is equal to how many c class 8 maths CBSE
What is BLO What is the full form of BLO class 8 social science CBSE
What helps Frog to breathe underwater class 8 biology CBSE
Citizens of India can vote at the age of A 18 years class 8 social science CBSE
Name the states through which the Tropic of Cancer class 8 social science CBSE
Full form of STD, ISD and PCO