


The following are distance/time graphs. Which graph shows an object traveling at a constant speed?
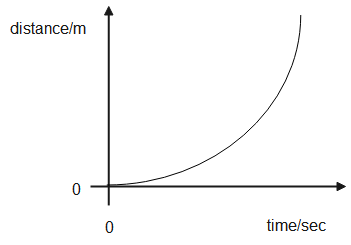
A)
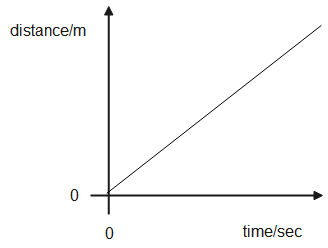
B)
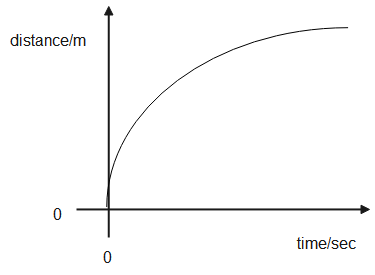
C)
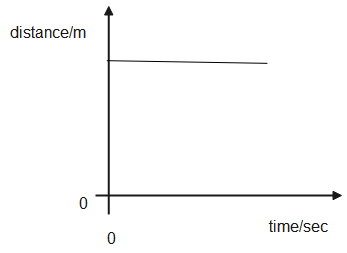
D)
Answer
593.7k+ views
Hint: We know how to calculate speed with the help of distance and time values. A distance-time graph tells us the distance traveled by an object in a given time. If we get a Straight line graph it means the object traveling at a constant speed.
Complete answer:
If the object travels at a constant speed then we will get nearly the same values of distance and time. So, we easily obtain a straight-line graph on a distance-time graph.
In another way, we can imagine stationary object means object at rest as traveling at constant speed says 0m/sec.
Options A and C show curved lines on the distance/time graph and it tells us the speed is changing.
Option D shows a constant line on the distance/time graph it tells us there is no changing of distance but time is changing.
Hence the option B is the correct answer.
Additional information:
By using distance and time graphs we can calculate the speed of the object. The speed can be defined as the object is the distance traveled by it in unit time.
If you draw the slope on a straight line in the distance/time graph we will get the average speed of the object.
Likewise, if you have a curved line on the distance v/s time graph it means constantly changing speed. We can find the speed at that point in time by drawing a tangent at a curved line.
Note:
Remember the very common formula ${\text{speed = }}\dfrac{{{\text{distance}}}}{{{\text{time}}}}$. So, we can handle these types of questions on a distance/time graph. In this kind of question, we have to solve where you are getting a constant value of speed.
Recently Updated Pages
Master Class 11 Social Science: Engaging Questions & Answers for Success
Master Class 11 English: Engaging Questions & Answers for Success
Master Class 11 Maths: Engaging Questions & Answers for Success
Master Class 11 Chemistry: Engaging Questions & Answers for Success
Master Class 11 Biology: Engaging Questions & Answers for Success
Master Class 11 Physics: Engaging Questions & Answers for Success
Trending doubts
One Metric ton is equal to kg A 10000 B 1000 C 100 class 11 physics CBSE
Difference Between Prokaryotic Cells and Eukaryotic Cells
Draw a diagram of a plant cell and label at least eight class 11 biology CBSE
Two of the body parts which do not appear in MRI are class 11 biology CBSE
Which gas is abundant in air class 11 chemistry CBSE
10 examples of friction in our daily life