


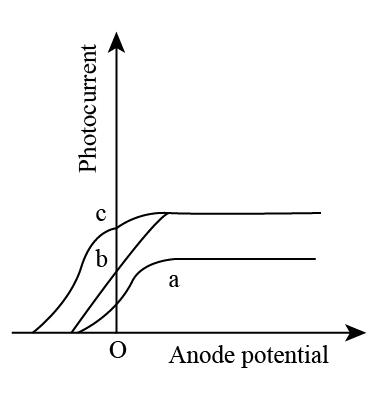
The figure shows the variation of photocurrent with anode potential for a photo-sensitive surface for three different radiations. Let\[{I_a}\], \[{I_b}\] and \[{I_c}\] be the intensities and \[{\upsilon _a}{\rm{, }}{\upsilon _b}\] and \[{\upsilon _c}\] be the frequencies for the curves a, b and c respectively. Then:
A. \[{\upsilon _a} = {\upsilon _b}\] and \[{I_a} \ne {I_b}\]
B. \[{\upsilon _a} > {\upsilon _c}\] and \[{I_a} \ne {I_c}\]
C. \[{\upsilon _a} < {\upsilon _b}\] and \[{I_a} \ne {I_b}\]
D. \[{\upsilon _b} = {\upsilon _c}\] and \[{I_b} = {I_c}\]
Answer
636k+ views
Hint: The intensity of saturation is directly proportional to intensity and stopping potential is directly proportional to the frequency. On the basis of this statement we will be establishing the relationship between potential and frequency to find out which option is correct.
Complete step by step solution:
We know that the stopping potential is directly proportional to the frequency.
\[{V_{St.}} \propto \upsilon \]……(1)
Using equation (1) and closely observing the given figure, we can state that the stopping potential of curve a and curve b is directly proportional to their respective frequencies.
\[{V_a} \propto {\upsilon _a}\]......(2)
\[{V_b} \propto {\upsilon _b}\]……(3)
On dividing equation (2) and equation (3), we get:
\[\dfrac{{{V_a}}}{{{V_b}}} = \dfrac{{{\upsilon _a}}}{{{\upsilon _b}}}\]……(4)
It can also be observed from the figure that stopping potential for curve a and b are equal.
\[\begin{array}{l}
{V_a} = {V_b}\\
\dfrac{{{V_a}}}{{{V_b}}} = 1
\end{array}\]
Substitute \[\dfrac{{{V_a}}}{{{V_b}}} = 1\] in equation (4)
\[\begin{array}{l}
1 = \dfrac{{{\upsilon _a}}}{{{\upsilon _b}}}\\
{\upsilon _a} = {\upsilon _b}
\end{array}\]
We also know that the intensity of saturation is directly proportional to the intensity.
\[{I_{sat.}} \propto I\]……(5)
Again by closely observing the figure and using equation (5), it can be stated that the intensities of curve a, b and c are not equal.
\[{I_a} \ne {I_b} \ne {I_c}\]
Therefore, the option (A) that is \[{\upsilon _a} = {\upsilon _b}\] and \[{I_a} \ne {I_b}\] is correct.
Note: While writing the individual equations for relationship between potential and frequency of curve a and b do not confuse in removing the proportionality sign to find a relation between potential and frequency of curve a and b. Alternatively, rather than finding the ratio of potential of curve a and b we can substitute the value of potential of curve a equal to curve b which will come out to be the same as what we already got in our solution.
Recently Updated Pages
Master Class 11 English: Engaging Questions & Answers for Success
Master Class 11 Physics: Engaging Questions & Answers for Success
Master Class 11 Computer Science: Engaging Questions & Answers for Success
Master Class 11 Chemistry: Engaging Questions & Answers for Success
Master Class 11 Social Science: Engaging Questions & Answers for Success
Master Class 11 Accountancy: Engaging Questions & Answers for Success
Trending doubts
Difference Between Prokaryotic Cells and Eukaryotic Cells
Two of the body parts which do not appear in MRI are class 11 biology CBSE
One Metric ton is equal to kg A 10000 B 1000 C 100 class 11 physics CBSE
10 examples of friction in our daily life
Draw a diagram of nephron and explain its structur class 11 biology CBSE
Draw a diagram of a plant cell and label at least eight class 11 biology CBSE