


The extreme values of cos x are:
(a) \[\dfrac{\sqrt{3}}{2}\text{ and }\dfrac{1}{\sqrt{2}}\]
(b) – 1 and 0
(c) – 1 and 1
(d) 0 and 1
Answer
615k+ views
Hint: Find a few points on the positive x-axis and few points on the negative x-axis and plot them. As cos x is periodic, first plot the graph of cos x and then find the maximum, minimum from that. These are the extreme values which are the required result of the question.
Complete step-by-step answer:
Extreme Values: The maximum and minimum value of the function in its range are called extreme values of the function. We need a graph of the function to solve this question.
The value of cos x at x = 0 can be given as:
\[\cos \left( 0 \right)=1\]
The value of cos x at \[x=\dfrac{\pi }{6},\] can be given as:
\[\cos \left( \dfrac{\pi }{6} \right)=\dfrac{\sqrt{3}}{2}\]
The value of cos x at \[x=\dfrac{\pi }{4},\] can be given as:
\[\cos \left( \dfrac{\pi }{4} \right)=\dfrac{1}{\sqrt{2}}\]
The value of cos at \[x=\dfrac{\pi }{3},\] can be given as:
\[\cos \left( \dfrac{\pi }{3} \right)=\dfrac{1}{2}\]
The value of cos x at \[x=\dfrac{\pi }{2},\] can be given as:
\[\cos \left( \dfrac{\pi }{2} \right)=0\]
The value of cos x at \[x=\dfrac{-\pi }{6},\] can be given as:
\[\cos \left( \dfrac{-\pi }{6} \right)=\dfrac{\sqrt{3}}{2}\]
The value of cos x at \[x=\dfrac{-\pi }{4},\]can be given as:
\[\cos \left( \dfrac{-\pi }{4} \right)=\dfrac{1}{\sqrt{2}}\]
The value of cos x at \[x=\dfrac{-\pi }{3},\] can be given as:
\[\cos \left( \dfrac{-\pi }{3} \right)=\dfrac{1}{2}\]
The value of cos x at \[x=\dfrac{-\pi }{2},\] can be given as:
\[\cos \left( \dfrac{-\pi }{2} \right)=0\]
So, cos x in the range of \[\left( \dfrac{\pi }{2},\pi \right)\] repeats as the \[\left( 0,\dfrac{\pi }{2} \right)\] but negative way. And in the range \[\left( \dfrac{-\pi }{2},-\pi \right)\] repeats as \[\left( \dfrac{\pi }{2},0 \right)\] in a negative way and it is periodic. So, we can plot it as:
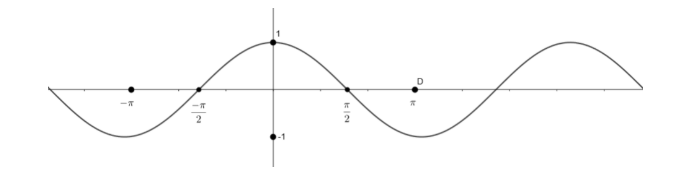
As you can see the graph always lies between – 1 and 1. So, the extreme values are – 1, 1.
Therefore, option (c) is the right answer.
Note: Be careful while plotting each and every point because even a mistake at one point may affect the whole shape of the graph. While checking the extreme values, take care that you cover the whole range because even after some values, it further crosses it, and then the answer might be wrong.
Complete step-by-step answer:
Extreme Values: The maximum and minimum value of the function in its range are called extreme values of the function. We need a graph of the function to solve this question.
The value of cos x at x = 0 can be given as:
\[\cos \left( 0 \right)=1\]
The value of cos x at \[x=\dfrac{\pi }{6},\] can be given as:
\[\cos \left( \dfrac{\pi }{6} \right)=\dfrac{\sqrt{3}}{2}\]
The value of cos x at \[x=\dfrac{\pi }{4},\] can be given as:
\[\cos \left( \dfrac{\pi }{4} \right)=\dfrac{1}{\sqrt{2}}\]
The value of cos at \[x=\dfrac{\pi }{3},\] can be given as:
\[\cos \left( \dfrac{\pi }{3} \right)=\dfrac{1}{2}\]
The value of cos x at \[x=\dfrac{\pi }{2},\] can be given as:
\[\cos \left( \dfrac{\pi }{2} \right)=0\]
The value of cos x at \[x=\dfrac{-\pi }{6},\] can be given as:
\[\cos \left( \dfrac{-\pi }{6} \right)=\dfrac{\sqrt{3}}{2}\]
The value of cos x at \[x=\dfrac{-\pi }{4},\]can be given as:
\[\cos \left( \dfrac{-\pi }{4} \right)=\dfrac{1}{\sqrt{2}}\]
The value of cos x at \[x=\dfrac{-\pi }{3},\] can be given as:
\[\cos \left( \dfrac{-\pi }{3} \right)=\dfrac{1}{2}\]
The value of cos x at \[x=\dfrac{-\pi }{2},\] can be given as:
\[\cos \left( \dfrac{-\pi }{2} \right)=0\]
So, cos x in the range of \[\left( \dfrac{\pi }{2},\pi \right)\] repeats as the \[\left( 0,\dfrac{\pi }{2} \right)\] but negative way. And in the range \[\left( \dfrac{-\pi }{2},-\pi \right)\] repeats as \[\left( \dfrac{\pi }{2},0 \right)\] in a negative way and it is periodic. So, we can plot it as:
As you can see the graph always lies between – 1 and 1. So, the extreme values are – 1, 1.
Therefore, option (c) is the right answer.
Note: Be careful while plotting each and every point because even a mistake at one point may affect the whole shape of the graph. While checking the extreme values, take care that you cover the whole range because even after some values, it further crosses it, and then the answer might be wrong.
Recently Updated Pages
Basicity of sulphurous acid and sulphuric acid are
Master Class 11 Business Studies: Engaging Questions & Answers for Success
Master Class 11 Computer Science: Engaging Questions & Answers for Success
Master Class 11 Economics: Engaging Questions & Answers for Success
Master Class 11 Social Science: Engaging Questions & Answers for Success
Master Class 11 English: Engaging Questions & Answers for Success
Trending doubts
One Metric ton is equal to kg A 10000 B 1000 C 100 class 11 physics CBSE
The largest wind power cluster is located in the state class 11 social science CBSE
Explain zero factorial class 11 maths CBSE
State and prove Bernoullis theorem class 11 physics CBSE
Which among the following are examples of coming together class 11 social science CBSE
Can anyone list 10 advantages and disadvantages of friction