


The exam scores of all $500$ students were recorded and it was determined that these scores were normally distributed. If Jane’s score is $0.8$ standard deviation above the mean, then how many, to the nearest unit, students scored above Jane? (Area under the curve below $z=0.8$ is $0.7881$)
Answer
579k+ views
Hint: For this problem we will find the value of Jane’s score by using the given data i.e. Jane’s score is $0.8$ standard deviation above the mean from this we will get an equation for the value to be standardized. Now we have the formula for the $z$ score in normal distribution as $z=\dfrac{x-\mu }{\sigma }$
Where
$x$ is the value to be standardized.
$\mu $ is the mean of the distribution.
$\sigma $ is the standard deviation of the distribution.
By substituting all the above values, we will get the value of $z$ score. For the obtained $z$ score we will calculate the area under the curve for the normal distribution. This value represents the percentage of students who scored below or equal to Jane's score. Here we will get the percentage of students who scored more than Jane's score by subtracting the percentage of students who scored below or equal to Jane's score from One. From the percentage of students who scored more than Jane's score, we will calculate the number of students by multiplying the obtained value with $500$.
Complete step by step answer:
Given that,
Jane’s score is $0.8$ standard deviation above the mean.
Let the mean of the given normal distribution is $m$, then $\mu =m$.
Let the standard deviation of the given normal distribution is $s$, then $\sigma =s$
Then the Jane's score is calculated from the given condition is
$\begin{align}
& x=0.8\left( \text{Standard deviation} \right)+\text{Mean} \\
& x=0.8s+m \\
\end{align}$
Now calculating the $z$ score of Jane’s by substituting the values of $x,\mu ,\sigma $ in the formula $z=\dfrac{x-\mu }{\sigma }$, then we will have
$\begin{align}
& z=\dfrac{x-\mu }{\sigma } \\
& =\dfrac{0.8s+m-m}{s} \\
& =\dfrac{0.8s}{s} \\
& =0.8 \\
\end{align}$
To find the probability of the students who got less than or equal to Jane's score is calculated by finding the area under the curve for $z=0.8$. In the problem they have mentioned the area under the curve for $z=0.8$ as $0.7881$. Hence the percentage of students who got less than or equal to Jane's score is $0.7881$.
But here we need to calculate the percentage of students who got more than Jane's score. We know that the sum of the percentage of students who got less than or equal to Jane's score and the percentage of students who got more than Jane's score. Hence
Percentage of students who got more than Jane’s score $=1-0.7881=0.2119$.
The number of students who got more than Jane's score in $500$ students is
$\begin{align}
& =0.2119\times 500 \\
& =105.95 \\
& \simeq 106 \\
\end{align}$
So, from this we can say that $106$ students scored more than Jane.
Note: Sometime the area under the curve for a $z$value in normal distribution is not mentioned, then we need to use the normal distribution table given below
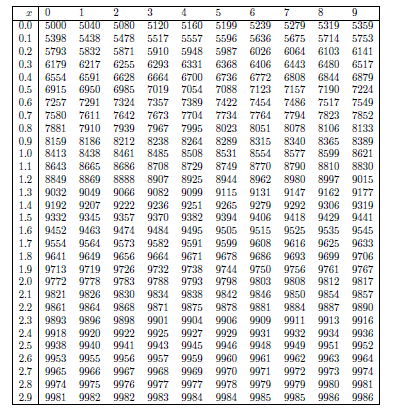
Students need to understand the what the table is giving. The above table gives the area under the curve for the normal distribution. We will see another table for the same distribution
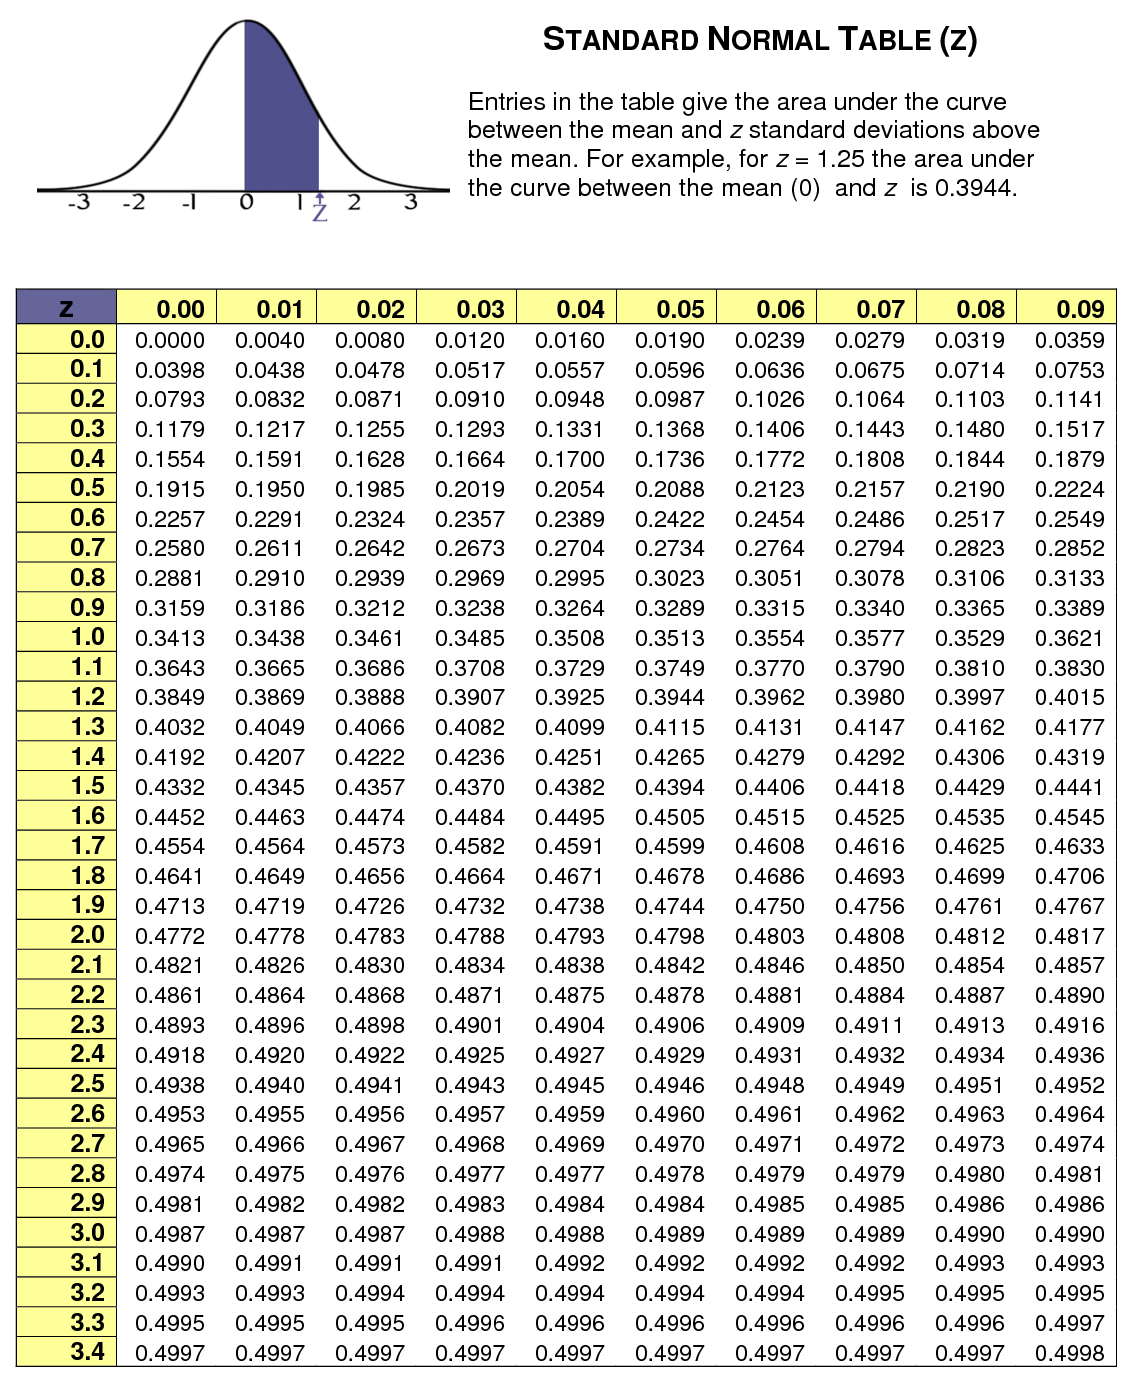
In the above table we will get the area under the curve above the mean. But for this problem we only need the value under the curve so we used the first table.
Where
$x$ is the value to be standardized.
$\mu $ is the mean of the distribution.
$\sigma $ is the standard deviation of the distribution.
By substituting all the above values, we will get the value of $z$ score. For the obtained $z$ score we will calculate the area under the curve for the normal distribution. This value represents the percentage of students who scored below or equal to Jane's score. Here we will get the percentage of students who scored more than Jane's score by subtracting the percentage of students who scored below or equal to Jane's score from One. From the percentage of students who scored more than Jane's score, we will calculate the number of students by multiplying the obtained value with $500$.
Complete step by step answer:
Given that,
Jane’s score is $0.8$ standard deviation above the mean.
Let the mean of the given normal distribution is $m$, then $\mu =m$.
Let the standard deviation of the given normal distribution is $s$, then $\sigma =s$
Then the Jane's score is calculated from the given condition is
$\begin{align}
& x=0.8\left( \text{Standard deviation} \right)+\text{Mean} \\
& x=0.8s+m \\
\end{align}$
Now calculating the $z$ score of Jane’s by substituting the values of $x,\mu ,\sigma $ in the formula $z=\dfrac{x-\mu }{\sigma }$, then we will have
$\begin{align}
& z=\dfrac{x-\mu }{\sigma } \\
& =\dfrac{0.8s+m-m}{s} \\
& =\dfrac{0.8s}{s} \\
& =0.8 \\
\end{align}$
To find the probability of the students who got less than or equal to Jane's score is calculated by finding the area under the curve for $z=0.8$. In the problem they have mentioned the area under the curve for $z=0.8$ as $0.7881$. Hence the percentage of students who got less than or equal to Jane's score is $0.7881$.
But here we need to calculate the percentage of students who got more than Jane's score. We know that the sum of the percentage of students who got less than or equal to Jane's score and the percentage of students who got more than Jane's score. Hence
Percentage of students who got more than Jane’s score $=1-0.7881=0.2119$.
The number of students who got more than Jane's score in $500$ students is
$\begin{align}
& =0.2119\times 500 \\
& =105.95 \\
& \simeq 106 \\
\end{align}$
So, from this we can say that $106$ students scored more than Jane.
Note: Sometime the area under the curve for a $z$value in normal distribution is not mentioned, then we need to use the normal distribution table given below
Students need to understand the what the table is giving. The above table gives the area under the curve for the normal distribution. We will see another table for the same distribution
In the above table we will get the area under the curve above the mean. But for this problem we only need the value under the curve so we used the first table.
Recently Updated Pages
Master Class 11 Computer Science: Engaging Questions & Answers for Success
Master Class 11 Business Studies: Engaging Questions & Answers for Success
Master Class 11 Economics: Engaging Questions & Answers for Success
Master Class 11 English: Engaging Questions & Answers for Success
Master Class 11 Maths: Engaging Questions & Answers for Success
Master Class 11 Biology: Engaging Questions & Answers for Success
Trending doubts
One Metric ton is equal to kg A 10000 B 1000 C 100 class 11 physics CBSE
There are 720 permutations of the digits 1 2 3 4 5 class 11 maths CBSE
Discuss the various forms of bacteria class 11 biology CBSE
Draw a diagram of a plant cell and label at least eight class 11 biology CBSE
State the laws of reflection of light
Explain zero factorial class 11 maths CBSE