


The driver of a car travelling at $52km{{h}^{-1}}$ applies the brake and accelerates uniformly in the opposite direction. The car stops in $5s$. Another driver going at $3km{{h}^{-1}}$ in another car applies his brakes slowly and stops in $10s$. On the same graph paper, plot the speed versus time graphs for the two cars. Which of the two cars travelled farther after the brakes were applied?
Answer
624.9k+ views
Hint: In a velocity-time graph, the slope is given by the acceleration of the body. This is because acceleration is nothing but the change in velocity per second of a body. If the body is decelerating, it will have a negative slope. The total area under a velocity-time graph gives the displacement of the body. This is because velocity is the change in displacement per second of the body.
Formula used:
In a velocity time graph,
$a=\dfrac{\Delta v}{\Delta t}$
where $a$ is the acceleration of the body, $\Delta v$ is the change in velocity of the body in a time period $\Delta t$. Hence, acceleration forms the slope of a line in the velocity time graph.
$s=\sum\limits_{t=0}^{t=t}{v\Delta t}$
Where $s$ is the displacement covered by the body. That is, the area under a velocity time graph is the displacement covered by the body.
The equation of a line with a point $\left( {{x}_{1}},{{y}_{1}} \right)$on it and slope $m$is given by
$y-{{y}_{1}}=m\left( x-{{x}_{1}} \right)$ --(2)
Complete step by step answer:
In a velocity time graph,
$a=\dfrac{\text{final velocity-initial velocity}}{\text{time period}}=\dfrac{\Delta v}{\Delta t}$ --(1)
where $a$is the acceleration of the body, $\Delta v$ is the change in velocity of the body in a time period $\Delta t$. Hence, acceleration forms the slope of a line in the velocity time graph.
The equation of a line with a point $\left( {{x}_{1}},{{y}_{1}} \right)$on it and slope $m$is given by
$y-{{y}_{1}}=m\left( x-{{x}_{1}} \right)$ --(2)
Hence, to plot the velocity-time graphs of the two bodies we will require the initial and final velocities of the bodies and the time interval in which there was acceleration.
For the first car,
Initial velocity of the car ${{u}_{1}}=52km{{h}^{-1}}=52\times \dfrac{5}{18}=14.44m.{{s}^{-1}}$
Final velocity of the car ${{v}_{1}}=0$
Time period $\Delta t=5s$
Therefore, using (1),
Acceleration $a=\dfrac{0-14.44}{5}=-2.89m.{{s}^{-2}}$
Hence, slope of plot $=-2.89m.{{s}^{-2}}$ --(3)
Now, one point on the plot is $\left( 5,0 \right)$--(4)
since, the car comes to rest at $t=5s$
Hence, using (2), (3) and (4), the equation for the plot will be
$v-0=-2.89\left( t-5 \right)$ --(5)
Similarly for the second car,
Initial velocity of the car ${{u}_{2}}=3km{{h}^{-1}}=3\times \dfrac{5}{18}=0.83m.{{s}^{-1}}$
Final velocity of the car ${{v}_{2}}=0$
Time period $\Delta t=10s$
Therefore, using (1),
Acceleration $a=\dfrac{0-0.83}{10}=-0.083m.{{s}^{-2}}$
Hence, slope of plot $=-0.083m.{{s}^{-2}}$ --(6)
Now, one point on the plot is $\left( 10,0 \right)$--(7)
since, the car comes to rest at $t=10s$
Hence, using (2), (6) and (7), the equation for the plot will be
$v-0=-0.083\left( t-10 \right)$ --(8)
Therefore using (5) and (8) to plot the two lines, we get,
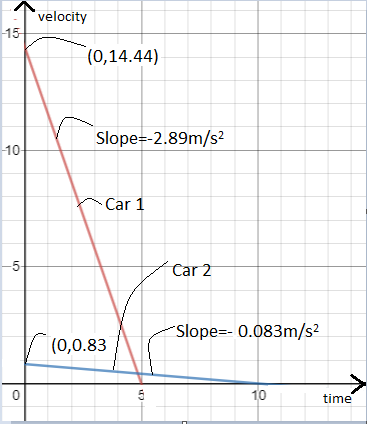
Now, displacement covered by car 1 is the area under its velocity time graph.
Therefore, it is the area of the triangle whose sides are the red line and the two positive axes.
Therefore, displacement of car 1 will be,
$\dfrac{1}{2}\times \text{base}\times \text{height}$ (since this is the area of a triangle).
From the graph, we plug in the corresponding values and get,
$=\dfrac{1}{2}\times 5\times 14.44=36.1m$
Similarly displacement of car 2 will be,
$\dfrac{1}{2}\times \text{base}\times \text{height}$ (since this is the area of a triangle).
From the graph, we plug in the corresponding values and get,
$=\dfrac{1}{2}\times 10\times 0.83=4.15m$
Hence, clearly, car 1 travelled further after the brakes were applied.
Note: One should always remember the relations between graphs of displacement, velocity and acceleration with time and the significances of certain curves in them. A lot of tricky questions can be based upon these graphs as they are not very intuitive to everyone.
A good way to understand tricky graphs in such questions is to break them into smaller parts and analyze each part separately. For example, in this question, we broke the question into two parts (one for the first car and the other for the second) and solved individually for each. Then we plotted them together. A single graph containing a lot of turning points and curves can also be broken down into individual parts and analyzed separately for better and quicker understanding.A common mistake that could happen in these problems is that students tend to forget that deceleration gives rise to a negative slope. Since it is more intuitive to many, they think that acceleration will always form a positive slope. However, this is completely wrong and the student will end up making a completely wrong graph.
Formula used:
In a velocity time graph,
$a=\dfrac{\Delta v}{\Delta t}$
where $a$ is the acceleration of the body, $\Delta v$ is the change in velocity of the body in a time period $\Delta t$. Hence, acceleration forms the slope of a line in the velocity time graph.
$s=\sum\limits_{t=0}^{t=t}{v\Delta t}$
Where $s$ is the displacement covered by the body. That is, the area under a velocity time graph is the displacement covered by the body.
The equation of a line with a point $\left( {{x}_{1}},{{y}_{1}} \right)$on it and slope $m$is given by
$y-{{y}_{1}}=m\left( x-{{x}_{1}} \right)$ --(2)
Complete step by step answer:
In a velocity time graph,
$a=\dfrac{\text{final velocity-initial velocity}}{\text{time period}}=\dfrac{\Delta v}{\Delta t}$ --(1)
where $a$is the acceleration of the body, $\Delta v$ is the change in velocity of the body in a time period $\Delta t$. Hence, acceleration forms the slope of a line in the velocity time graph.
The equation of a line with a point $\left( {{x}_{1}},{{y}_{1}} \right)$on it and slope $m$is given by
$y-{{y}_{1}}=m\left( x-{{x}_{1}} \right)$ --(2)
Hence, to plot the velocity-time graphs of the two bodies we will require the initial and final velocities of the bodies and the time interval in which there was acceleration.
For the first car,
Initial velocity of the car ${{u}_{1}}=52km{{h}^{-1}}=52\times \dfrac{5}{18}=14.44m.{{s}^{-1}}$
Final velocity of the car ${{v}_{1}}=0$
Time period $\Delta t=5s$
Therefore, using (1),
Acceleration $a=\dfrac{0-14.44}{5}=-2.89m.{{s}^{-2}}$
Hence, slope of plot $=-2.89m.{{s}^{-2}}$ --(3)
Now, one point on the plot is $\left( 5,0 \right)$--(4)
since, the car comes to rest at $t=5s$
Hence, using (2), (3) and (4), the equation for the plot will be
$v-0=-2.89\left( t-5 \right)$ --(5)
Similarly for the second car,
Initial velocity of the car ${{u}_{2}}=3km{{h}^{-1}}=3\times \dfrac{5}{18}=0.83m.{{s}^{-1}}$
Final velocity of the car ${{v}_{2}}=0$
Time period $\Delta t=10s$
Therefore, using (1),
Acceleration $a=\dfrac{0-0.83}{10}=-0.083m.{{s}^{-2}}$
Hence, slope of plot $=-0.083m.{{s}^{-2}}$ --(6)
Now, one point on the plot is $\left( 10,0 \right)$--(7)
since, the car comes to rest at $t=10s$
Hence, using (2), (6) and (7), the equation for the plot will be
$v-0=-0.083\left( t-10 \right)$ --(8)
Therefore using (5) and (8) to plot the two lines, we get,
Now, displacement covered by car 1 is the area under its velocity time graph.
Therefore, it is the area of the triangle whose sides are the red line and the two positive axes.
Therefore, displacement of car 1 will be,
$\dfrac{1}{2}\times \text{base}\times \text{height}$ (since this is the area of a triangle).
From the graph, we plug in the corresponding values and get,
$=\dfrac{1}{2}\times 5\times 14.44=36.1m$
Similarly displacement of car 2 will be,
$\dfrac{1}{2}\times \text{base}\times \text{height}$ (since this is the area of a triangle).
From the graph, we plug in the corresponding values and get,
$=\dfrac{1}{2}\times 10\times 0.83=4.15m$
Hence, clearly, car 1 travelled further after the brakes were applied.
Note: One should always remember the relations between graphs of displacement, velocity and acceleration with time and the significances of certain curves in them. A lot of tricky questions can be based upon these graphs as they are not very intuitive to everyone.
A good way to understand tricky graphs in such questions is to break them into smaller parts and analyze each part separately. For example, in this question, we broke the question into two parts (one for the first car and the other for the second) and solved individually for each. Then we plotted them together. A single graph containing a lot of turning points and curves can also be broken down into individual parts and analyzed separately for better and quicker understanding.A common mistake that could happen in these problems is that students tend to forget that deceleration gives rise to a negative slope. Since it is more intuitive to many, they think that acceleration will always form a positive slope. However, this is completely wrong and the student will end up making a completely wrong graph.
Recently Updated Pages
Three beakers labelled as A B and C each containing 25 mL of water were taken A small amount of NaOH anhydrous CuSO4 and NaCl were added to the beakers A B and C respectively It was observed that there was an increase in the temperature of the solutions contained in beakers A and B whereas in case of beaker C the temperature of the solution falls Which one of the following statements isarecorrect i In beakers A and B exothermic process has occurred ii In beakers A and B endothermic process has occurred iii In beaker C exothermic process has occurred iv In beaker C endothermic process has occurred
Master Class 11 Social Science: Engaging Questions & Answers for Success
Master Class 11 Physics: Engaging Questions & Answers for Success
Master Class 11 Maths: Engaging Questions & Answers for Success
Master Class 11 Economics: Engaging Questions & Answers for Success
Master Class 11 Computer Science: Engaging Questions & Answers for Success
Three beakers labelled as A B and C each containing 25 mL of water were taken A small amount of NaOH anhydrous CuSO4 and NaCl were added to the beakers A B and C respectively It was observed that there was an increase in the temperature of the solutions contained in beakers A and B whereas in case of beaker C the temperature of the solution falls Which one of the following statements isarecorrect i In beakers A and B exothermic process has occurred ii In beakers A and B endothermic process has occurred iii In beaker C exothermic process has occurred iv In beaker C endothermic process has occurred
Master Class 11 Social Science: Engaging Questions & Answers for Success
Master Class 11 Physics: Engaging Questions & Answers for Success
Trending doubts
One Metric ton is equal to kg A 10000 B 1000 C 100 class 11 physics CBSE
There are 720 permutations of the digits 1 2 3 4 5 class 11 maths CBSE
State and prove Bernoullis theorem class 11 physics CBSE
Draw a diagram of a plant cell and label at least eight class 11 biology CBSE
Difference Between Prokaryotic Cells and Eukaryotic Cells
Discuss the various forms of bacteria class 11 biology CBSE