


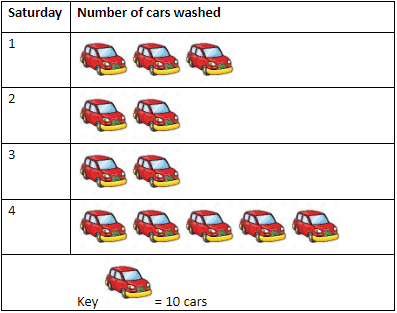
The Delhi School’s football team washed cars every Saturday for a month to raise money for the local children’s hospital. The students charged Rs. \[5\] for each car they washed. The pictograph above shows the total number of cars washed by the team. What is the total amount of money raised by the football team?
A. Rs. \[120\]
B. Rs. \[300\]
C. Rs.\[550\]
D. Rs. \[600\]
Answer
621k+ views
Hint: At first, we will find the number of cars they washed on each Saturday.
Next, we will find the total number of cars by using a symbol of 10 cars.
Using the unitary method, we will find the total amount that they collected.
Complete step by step solution:
It is given that; the Delhi School’s football team washed cars every Saturday for a month to raise money for the local children’s hospital. The students charged Rs. \[5\] for each car they washed. The pictograph above shows the total number of cars washed by the team.
It is also given a symbol of a car is 10 cars.
The number of cars is given through a pictograph.
According to the pictograph,
On first Saturday, number of cars that the team washed \[ = 3 \times 10 = 30\]
On second Saturday, number of cars that the team washed \[ = 2 \times 10 = 20\]
On third Saturday, number of cars that the team washed \[ = 2 \times 10 = 20\]
On fourth Saturday, number of cars that the team washed \[ = 5 \times 10 = 50\]
The total number of cars that they washed in four Saturdays \[ = 30 + 20 + 20 + 50 = 120\]
Now, they charged Rs. \[5\] for each car they washed.
So, the total amount that they collected Rs. \[5 \times 120 = \] Rs. \[600\]
So, the total amount of money raised by the football team is Rs. \[600\].
Hence, the correct option is D) Rs. \[600\]
Note: A pictograph is the representation of data using images. Pictographs represent the frequency data while using symbols or images that are relevant to the data.
This is one of the simplest ways to represent statistical data. And reading a pictograph is made extremely easy as well.
Pictographs are easy to read since all the information is available at one glance and since pictographs are universally used they do not require a lot of explanation.
Recently Updated Pages
Basicity of sulphurous acid and sulphuric acid are
Master Class 11 English: Engaging Questions & Answers for Success
Master Class 11 Physics: Engaging Questions & Answers for Success
Master Class 11 Computer Science: Engaging Questions & Answers for Success
Master Class 11 Chemistry: Engaging Questions & Answers for Success
Master Class 11 Social Science: Engaging Questions & Answers for Success
Trending doubts
Difference Between Prokaryotic Cells and Eukaryotic Cells
Two of the body parts which do not appear in MRI are class 11 biology CBSE
One Metric ton is equal to kg A 10000 B 1000 C 100 class 11 physics CBSE
10 examples of friction in our daily life
Draw a diagram of nephron and explain its structur class 11 biology CBSE
What will happen if the mucus is not secreted by the class 11 biology CBSE