


The data obtained by measuring the weight of students in a class on a certain day is given in the following distribution.
Weight (kg) 60-70 70-80 80-90 90-100 100-120 Frequency (no. of students) 3 5 10 9 2
Draw a histogram to represent this data.
| Weight (kg) | 60-70 | 70-80 | 80-90 | 90-100 | 100-120 |
| Frequency (no. of students) | 3 | 5 | 10 | 9 | 2 |
Answer
604.5k+ views
Hint: We here have been given some data and we have to draw its histogram. For this, we will first define what a histogram is. It will be defined as a graphical representation of bars in ranges. Each bar represents how many fall into a particular range. Then we will see what ranges we have been given and we will draw a histogram for it just as we draw a bar graph. Thus, we will get the required histogram.
Complete step by step answer:
We have been given some data and we have to draw its histogram.
To draw a histogram, we first need to know what is meant by it. A histogram is basically like a bar graph but there is a slight difference between them. In a bar graph, a whole bar represents the data of one particular number but in a histogram, a bar represents the data of a range.
Here also, we have been given the ranges of 60-7-, 70-80, 80-90, 90-100 and 100-120 and data regarding it.
We will draw this just like a bar graph only the markings will be according to the ranges.
Drawing it, we will get:
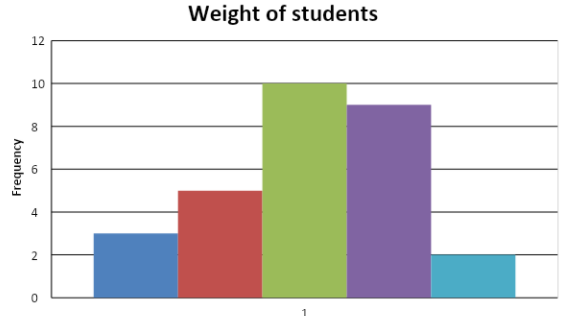
This is our required histogram.
Note:
Always be careful while differentiating between the different types of graphs. Bas graph and histogram also are almost the same but only a slight difference in markings of the graph will change one into the other. Hence, always read the question carefully and draw the right kind of graph.
Complete step by step answer:
We have been given some data and we have to draw its histogram.
To draw a histogram, we first need to know what is meant by it. A histogram is basically like a bar graph but there is a slight difference between them. In a bar graph, a whole bar represents the data of one particular number but in a histogram, a bar represents the data of a range.
Here also, we have been given the ranges of 60-7-, 70-80, 80-90, 90-100 and 100-120 and data regarding it.
We will draw this just like a bar graph only the markings will be according to the ranges.
Drawing it, we will get:
This is our required histogram.
Note:
Always be careful while differentiating between the different types of graphs. Bas graph and histogram also are almost the same but only a slight difference in markings of the graph will change one into the other. Hence, always read the question carefully and draw the right kind of graph.
Recently Updated Pages
Master Class 11 Social Science: Engaging Questions & Answers for Success
Master Class 11 English: Engaging Questions & Answers for Success
Master Class 11 Maths: Engaging Questions & Answers for Success
Master Class 11 Chemistry: Engaging Questions & Answers for Success
Master Class 11 Biology: Engaging Questions & Answers for Success
Master Class 11 Physics: Engaging Questions & Answers for Success
Trending doubts
One Metric ton is equal to kg A 10000 B 1000 C 100 class 11 physics CBSE
Difference Between Prokaryotic Cells and Eukaryotic Cells
How many of the following diseases can be studied with class 11 biology CBSE
Draw a diagram of a plant cell and label at least eight class 11 biology CBSE
Two of the body parts which do not appear in MRI are class 11 biology CBSE
Which gas is abundant in air class 11 chemistry CBSE