


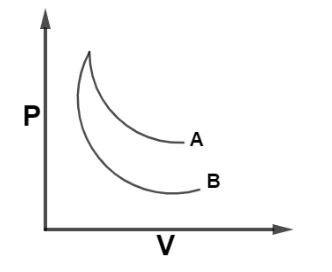
The curves A and B in figure shown P-V graphs for an isothermal and an adiabatic process of an ideal gas. The isothermal process is represented by the curve A.
A. True
B. False
Answer
510.3k+ views
Hint: In order to solve this question, we should know that an isothermal process is one where temperature of the system remains constant whereas an adiabatic process is one where temperature varies but heat remains constant. Here, we will study the slope of each curve and then determine which curve represents an isothermal process.
Complete step by step answer:
From the given diagram, we have two curves A and B represented in the P-V plane. So For an isothermal process the relation between pressure and volume is given as $PV = k$ where k is constant. So, slope of P-V curve for an isothermal can be written as by differentiating the above equation as,
$P(dV) + V(dP) = 0$
Since the differentiation of constant k is zero. so slope is,
$\dfrac{{dP}}{{dV}} = - \dfrac{P}{V} \to (i)$
Since the derivative $\dfrac{{dP}}{{dV}}$ represents the slope.
Now, for an adiabatic process, the pressure and volume are related as $P{V^\gamma } = k$ where $\gamma > 1$ is known as heat capacity ratio.Now, again differentiating this equation and finding slope for adiabatic curve we have,
$P\gamma {V^{\gamma - 1}}(dV) + {V^\gamma }(dP) = 0$
$\dfrac{{dP}}{{dV}} = - \gamma \dfrac{P}{V} \to (ii)$
From, equation (i) and (ii) we see that, slope of curve for isothermal process is less negative as compare to that of adiabatic curve as $\gamma > 1$ and from the diagram we can see that curve A bend less as compared to that of curve B so curve A will have less negative slope so, curve A represent the isothermal curve with slope of $\dfrac{{dP}}{{dV}} = - \dfrac{P}{V}$.
Hence, Curve A represents an isothermal curve so, the correct option is A.
Note: It should be remembered that, In case of expansion the work done in isothermal process is always greater than an adiabatic process and area under PV curve represents work done in the process so, larger the area covered by an curve, that curve will represent isothermal process, as in given figure curve A lies upper to that of curve B so curve A will cover more area hence, it’s an isothermal curve.
Recently Updated Pages
Master Class 12 Economics: Engaging Questions & Answers for Success
Master Class 12 English: Engaging Questions & Answers for Success
Master Class 12 Social Science: Engaging Questions & Answers for Success
Master Class 12 Maths: Engaging Questions & Answers for Success
Master Class 12 Physics: Engaging Questions & Answers for Success
Master Class 11 Social Science: Engaging Questions & Answers for Success
Trending doubts
One Metric ton is equal to kg A 10000 B 1000 C 100 class 11 physics CBSE
Difference Between Prokaryotic Cells and Eukaryotic Cells
Two of the body parts which do not appear in MRI are class 11 biology CBSE
1 ton equals to A 100 kg B 1000 kg C 10 kg D 10000 class 11 physics CBSE
Draw a diagram of nephron and explain its structur class 11 biology CBSE
10 examples of friction in our daily life