


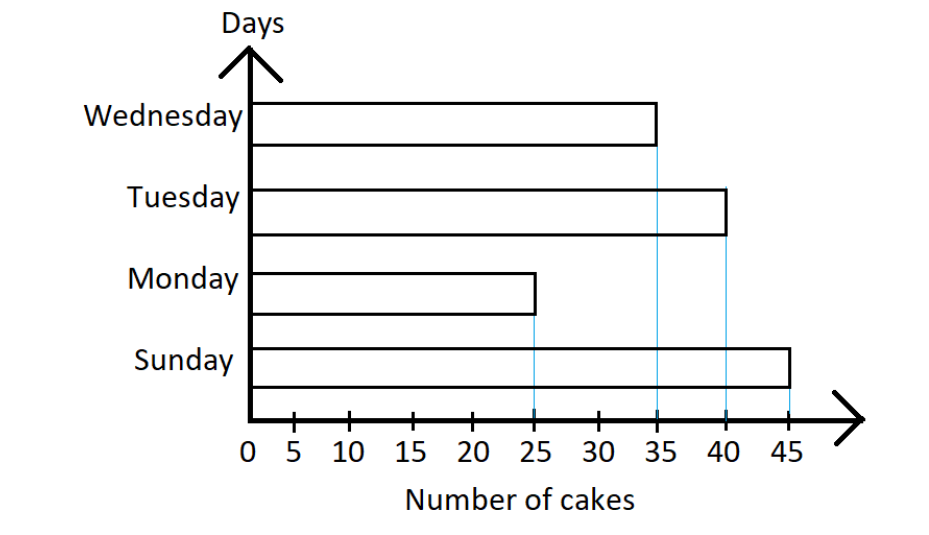
The bar graph shows the number of cakes sold at a shop in four days.
What is the difference in the number of cakes between the highest and the lowest daily sale?
A.\[20\]
B.\[35\]
C.\[30\]
D.\[40\]
Answer
527.7k+ views
Hint: In the given question, we should read and understand the bar graph to arrive at the conclusion. This given bar graph is different from normal bar graph as the bars are horizontal in the given case as compared to vertical bars. We can arrive at the answer by subtracting the value of longest bar by the smallest bar i.e. Sunday & Monday.
Complete step by step solution:
As we can see in the chart, the \[X - axis\] represents the number of cakes sold whereas the \[Y - axis\] shows the week days. The number of cakes sold are given in multiples of five.
Now the highest sale will be made on the day on which the bar stretches the longest horizontally and the lowest sale will be made on the day the bar stretches the shortest from the \[Y - axis\].
Hence, we can conclude that-
Highest Sale made on the day=Sunday
Number of Cakes sold on Sunday = \[45\]
Lowest Sale made on the day = Monday
Number of Cakes sold on Monday= \[25\]
Difference between highest and lowest daily sale will be-
\[ = 45 - 25\]
\[ = 20\] cakes
Thus Option (A) \[20\] is the correct answer.
So, the correct answer is “Option B”.
Note: A bar chart or bar graph is a chart or graph that uses rectangular bars with heights or lengths proportional to the values they represent to display categorical data. The bars may be plotted either horizontally or vertically. A column map is another name for a vertical bar chart.
Recently Updated Pages
Basicity of sulphurous acid and sulphuric acid are
Master Class 11 Business Studies: Engaging Questions & Answers for Success
Master Class 11 Computer Science: Engaging Questions & Answers for Success
Master Class 11 Economics: Engaging Questions & Answers for Success
Master Class 12 English: Engaging Questions & Answers for Success
Master Class 12 Social Science: Engaging Questions & Answers for Success
Trending doubts
Fill the blanks with the suitable prepositions 1 The class 9 english CBSE
Difference Between Plant Cell and Animal Cell
Find the sum of series 1 + 2 + 3 + 4 + 5 + + 100 class 9 maths CBSE
Distinguish between Conventional and nonconventional class 9 social science CBSE
Find the mode and median of the data 13 16 12 14 1-class-9-maths-CBSE
What is pollution? How many types of pollution? Define it