


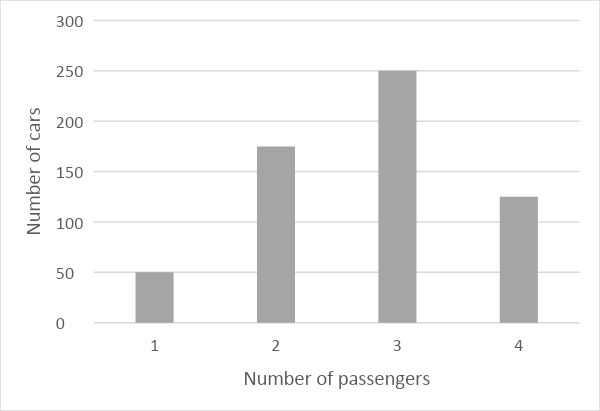
The bar graph below shows the number of cars passing through a toll tax. Find the percentage of cars which have at least 2 passengers.
A. $91\dfrac{2}{3}%$
B. $92\dfrac{4}{5}%$
C. $67\dfrac{1}{3}%$
D. $47\dfrac{1}{3}%$
Answer
538.8k+ views
Hint: Firstly we need to study the graph and the graph shows us that the scale of the graph is 1cm = 50 cars as 1 can be split into 10 small lines. Each small line is equal to 5 cars. Using this we can find the number of cars passed by toll tax and then find the percentage of them.
Complete step-by-step solution:
According to the question we are given a bar graph and asked for a percentage for a statement. And we can see that the bar graph has a scale of 1cm = 50 cars. From this we can get that each small line denotes 5 cars. Firstly let us see the bar denoting 1 passenger in a car.
As 1 big box or 1cm = 50 cars,
So, 1 passenger car is on the 1cm scale.
So, the number of total cars for 1 passenger = 50
Now, let us see the bar for 2 passengers in a car, bar denoting 3 full big boxes and 1 half box, which means = 150 + 25 = 175 cars.
Now, for 3 passenger cars = 5 big boxes = 250 cars.
And for 4 passenger cars = 2 big boxes + 1 half box = 100 + 25 = 125 cars.
So, the total cars = 50 + 175 + 250 + 125 = 600.
And total cars with at least 2 passengers = 175 + 250 + 125 = 550.
So, the percentage for this = $\dfrac{550}{600}\times 100=91\dfrac{2}{3}%$ .
So, the correct option is A.
Note: A bar graph can be defined as a chart or a graphical representation of data, quantities or numbers using bars or strips. Bar graphs are generally used in financial analysis for displaying data. A stock volume chart is a commonly used type of vertical bar graph.

Recently Updated Pages
Master Class 11 English: Engaging Questions & Answers for Success
Master Class 11 Maths: Engaging Questions & Answers for Success
Class 11 Question and Answer - Your Ultimate Solutions Guide
Master Class 11 Biology: Engaging Questions & Answers for Success
Master Class 11 Physics: Engaging Questions & Answers for Success
Master Class 11 Accountancy: Engaging Questions & Answers for Success
Trending doubts
Full Form of IASDMIPSIFSIRSPOLICE class 7 social science CBSE
List of coprime numbers from 1 to 100 class 7 maths CBSE
How many thousands make a crore class 7 maths CBSE
One lakh eight thousand how can we write it in num class 7 maths CBSE
Differentiate between map and globe class 7 social science CBSE
The southernmost point of the Indian mainland is known class 7 social studies CBSE