


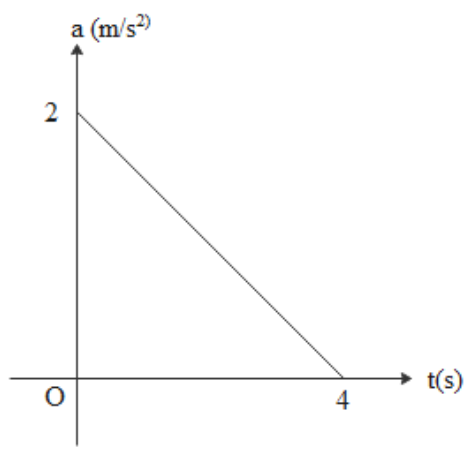
The a-t graph for a particle moving along a straight line is shown in the figure. If the initial velocity of the particle is 2 m/s then what is the velocity of the particle (in m/s) at t = 4 seconds?
A. 4
B. 6
C. 8
D. 10
Answer
579.9k+ views
Hint: An a-t graph is a plot between acceleration and time. The area under the acceleration-time graph curve gives the change in the velocity of the object.
Alternatively said, the area under the acceleration graph for a specific time interval gives the change in velocity during that time interval.
Formula used: Acceleration of a body, $a=\dfrac{{{v}_{f}}-{{v}_{i}}}{t}$
Complete step-by-step solution:
The area under the acceleration graph for a specific time interval gives the change in velocity during that time interval.
Acceleration of a body is defined as a change in its velocity per unit time. In other words, acceleration is the rate of change of velocity.
The area under the curve in the acceleration-time graph gives us a change in velocity.
Initial velocity of the particle is ${{v}_{i}}=2m/s$.
The area under the curve is the area of the triangle ABC as shown in the figure.
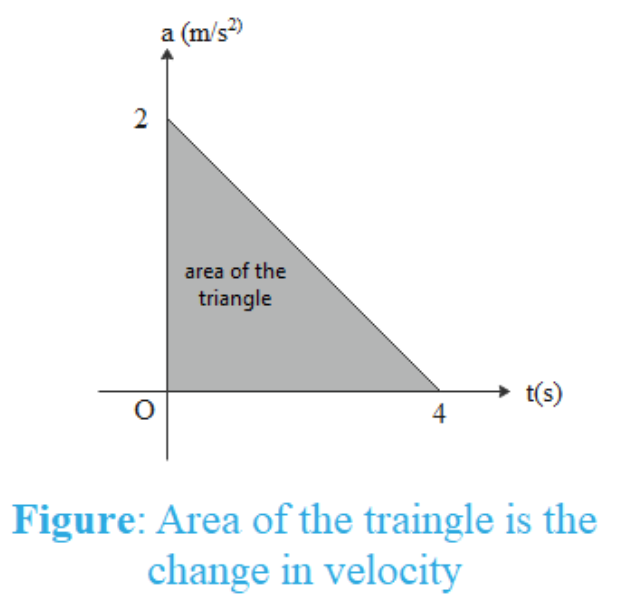
The area of a triangle is the product of its base length and height of the triangle as measured from the base.
Area under the curve = $\dfrac{1}{2}\times (base)\times (height)=\dfrac{1}{2}\times 4\times 2=4\,m/s$
This is the change in velocity of the object. Therefore,
${{v}_{f}}-{{v}_{i}}={{v}_{f}}-2\,m/s=4\,m/s$
$\Rightarrow {{v}_{f}}=2\,\text{m/s+4}\,\text{m/s=6}\,\text{m/s}$
Hence, option B is correct.
Additional information: Area under the curve in velocity-time graph denotes displacement. Velocity is the rate of change of position. It is also a vector quantity.
Note: Acceleration of a body is defined as the change in its velocity per unit time. It is a vector quantity. We did not use vectors in this question because the motion is in a straight line. The area under the acceleration graph for a specific time interval gives the change in velocity during that time interval.
Alternatively said, the area under the acceleration graph for a specific time interval gives the change in velocity during that time interval.
Formula used: Acceleration of a body, $a=\dfrac{{{v}_{f}}-{{v}_{i}}}{t}$
Complete step-by-step solution:
The area under the acceleration graph for a specific time interval gives the change in velocity during that time interval.
Acceleration of a body is defined as a change in its velocity per unit time. In other words, acceleration is the rate of change of velocity.
The area under the curve in the acceleration-time graph gives us a change in velocity.
Initial velocity of the particle is ${{v}_{i}}=2m/s$.
The area under the curve is the area of the triangle ABC as shown in the figure.
The area of a triangle is the product of its base length and height of the triangle as measured from the base.
Area under the curve = $\dfrac{1}{2}\times (base)\times (height)=\dfrac{1}{2}\times 4\times 2=4\,m/s$
This is the change in velocity of the object. Therefore,
${{v}_{f}}-{{v}_{i}}={{v}_{f}}-2\,m/s=4\,m/s$
$\Rightarrow {{v}_{f}}=2\,\text{m/s+4}\,\text{m/s=6}\,\text{m/s}$
Hence, option B is correct.
Additional information: Area under the curve in velocity-time graph denotes displacement. Velocity is the rate of change of position. It is also a vector quantity.
Note: Acceleration of a body is defined as the change in its velocity per unit time. It is a vector quantity. We did not use vectors in this question because the motion is in a straight line. The area under the acceleration graph for a specific time interval gives the change in velocity during that time interval.
Recently Updated Pages
Master Class 11 Computer Science: Engaging Questions & Answers for Success
Master Class 11 Business Studies: Engaging Questions & Answers for Success
Master Class 11 Economics: Engaging Questions & Answers for Success
Master Class 11 English: Engaging Questions & Answers for Success
Master Class 11 Maths: Engaging Questions & Answers for Success
Master Class 11 Biology: Engaging Questions & Answers for Success
Trending doubts
One Metric ton is equal to kg A 10000 B 1000 C 100 class 11 physics CBSE
There are 720 permutations of the digits 1 2 3 4 5 class 11 maths CBSE
Discuss the various forms of bacteria class 11 biology CBSE
Draw a diagram of a plant cell and label at least eight class 11 biology CBSE
State the laws of reflection of light
Explain zero factorial class 11 maths CBSE