


Suppose that next month Victoria registers twice as many clients as she did this month and that each of the other four salespeople registers the same number of clients as he or she did this month. In this case, what percentage of clients will Victoria have registered? \[\]
A. 36% \[\]
B.40%\[\]
C.44%\[\]
D.48%\[\]
E.52%\[\]
Answer
578.1k+ views
Hint: : We first find the number of clients Victoria registers $a$ next month by multiply 2 with this month. We find the total number of clients registered next month by adding up the clients registered by each employee. We find the percentage of clients $p$ Victoria would have registered next month as $p=\dfrac{a}{b}\times 100$.\[\]
Complete step-by-step solution:
We know that a bar chart or bar graph is a chart or graph that is grouped with rectangular bars with heights or lengths proportional to the values that they represent. \[\]
The percentage in mathematics is a number or ratio expressed as a fraction of 100. If we have $a$ number of elements and there are total $b$ number of elements then we can express $a$ as a percentage $p$ of $b$ using the working rule,
\[p=\dfrac{a}{b}\times 100\]
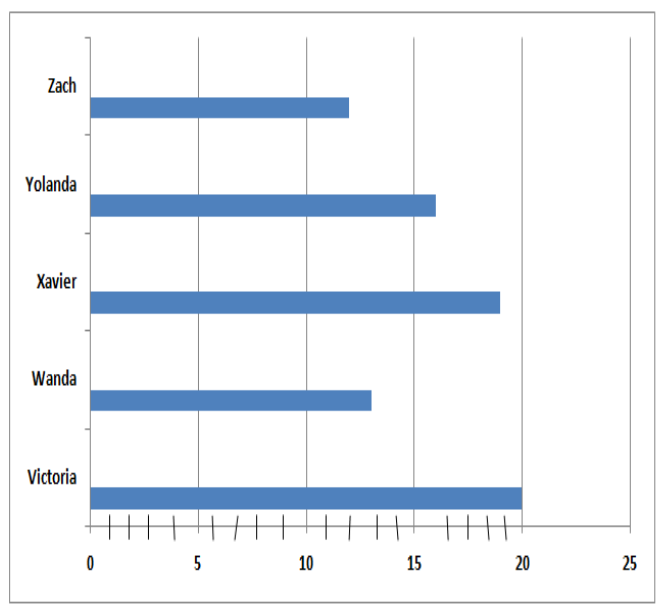
We see the bar graph in the question and find that we are given the data of 5 names of employees in an organization on the vertical axis and on the horizontal axis their corresponding number of clients registered by that person in a particular month. The length of the rectangular bar here represents is proportional to the number of clients registered. \[\]
The names of the 5 employees are Victoria, Wanda, Xavier, Yolanda, and Zach. The number of clients they register in a particular month is 20, 13, 19, 16, and 12 respectively.
We are given in the question that next month Victoria registers twice as many clients as she did this month. So the number of clients she registered in the next month is.
\[a=2\times 20=40\]
We are further given that each of the other four salespeople will register the same number of clients as he or she did this month. So the number of clients registered by Wanda, Xavier, Yolanda, and Zach are 13, 19, 16, and 12 respectively. \[\]
So the total number of clients registered by all of the employees in the next month is
\[b=40+13+19+16+12=100\]
So the percentage of clients will Victoria has registered out of the total number of clients registered next month is,
\[p=\dfrac{a}{b}\times 100=\dfrac{40}{100}\times 100=40\]
So Victoria will register 40% of the total clients and the correct option is B.
Note: We can also represent vertical bars on the horizontal axis with height proportional to the data value. There are two other types of bar chart grouped bar charts where two or more color-coded bars represent a category and stacked bar charts where bars on top of each other represent different groups. The histogram is a special type of vertical bar chart with continuous data.
Complete step-by-step solution:
We know that a bar chart or bar graph is a chart or graph that is grouped with rectangular bars with heights or lengths proportional to the values that they represent. \[\]
The percentage in mathematics is a number or ratio expressed as a fraction of 100. If we have $a$ number of elements and there are total $b$ number of elements then we can express $a$ as a percentage $p$ of $b$ using the working rule,
\[p=\dfrac{a}{b}\times 100\]
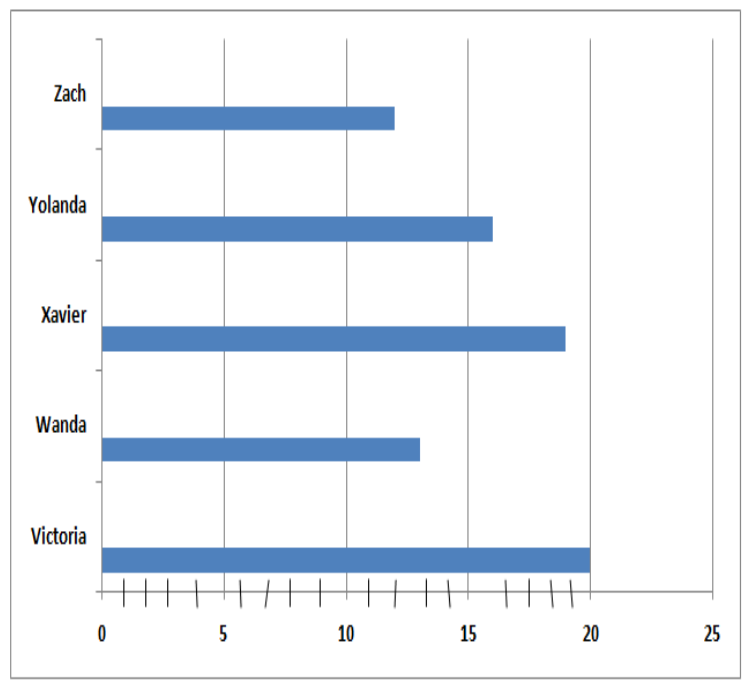
We see the bar graph in the question and find that we are given the data of 5 names of employees in an organization on the vertical axis and on the horizontal axis their corresponding number of clients registered by that person in a particular month. The length of the rectangular bar here represents is proportional to the number of clients registered. \[\]
The names of the 5 employees are Victoria, Wanda, Xavier, Yolanda, and Zach. The number of clients they register in a particular month is 20, 13, 19, 16, and 12 respectively.
We are given in the question that next month Victoria registers twice as many clients as she did this month. So the number of clients she registered in the next month is.
\[a=2\times 20=40\]
We are further given that each of the other four salespeople will register the same number of clients as he or she did this month. So the number of clients registered by Wanda, Xavier, Yolanda, and Zach are 13, 19, 16, and 12 respectively. \[\]
So the total number of clients registered by all of the employees in the next month is
\[b=40+13+19+16+12=100\]
So the percentage of clients will Victoria has registered out of the total number of clients registered next month is,
\[p=\dfrac{a}{b}\times 100=\dfrac{40}{100}\times 100=40\]
So Victoria will register 40% of the total clients and the correct option is B.
Note: We can also represent vertical bars on the horizontal axis with height proportional to the data value. There are two other types of bar chart grouped bar charts where two or more color-coded bars represent a category and stacked bar charts where bars on top of each other represent different groups. The histogram is a special type of vertical bar chart with continuous data.
Recently Updated Pages
Master Class 10 Computer Science: Engaging Questions & Answers for Success
Master Class 10 General Knowledge: Engaging Questions & Answers for Success
Master Class 10 English: Engaging Questions & Answers for Success
Master Class 10 Social Science: Engaging Questions & Answers for Success
Master Class 10 Maths: Engaging Questions & Answers for Success
Master Class 10 Science: Engaging Questions & Answers for Success
Trending doubts
Why is there a time difference of about 5 hours between class 10 social science CBSE
What is the median of the first 10 natural numbers class 10 maths CBSE
The draft of the Preamble of the Indian Constitution class 10 social science CBSE
Who gave "Inqilab Zindabad" slogan?
Write a letter to the principal requesting him to grant class 10 english CBSE
Who was Subhash Chandra Bose Why was he called Net class 10 english CBSE