


Study the following charts carefully and answer the question given.
Cars of which colours are $20\% $ less popular than white coloured cars?
Answer
510.6k+ views
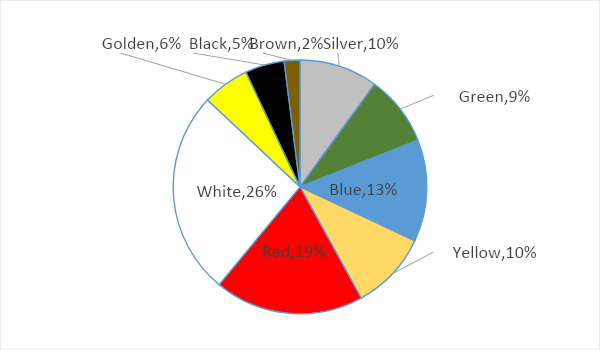
Hint: We have to find the colour of the car which is $20\% $ less popular than the white coloured car. The given chart is called a pie chart, the relative strength of each component is shown against a measure of the share of the pie a component occupies, so we can see that the pie’s white colour occupies the $26\% $ percent of the pie and other colours relative strength is also given in the chart. We will first find the value $20\% $ lesser than $26\% $ of white then see which colour is nearest to that value and those colours will be our answers. Note that the question asks ‘colours’ not ‘colour’.
Complete answer:
The white colour car occupies $26\% $ of the pie the question asks to find the cars which are $20\% $ less popular than this colour.
The $20\% $ of white’s share will be,
$ \Rightarrow \dfrac{{20}}{{100}} \times 26$
$ \Rightarrow 5.2\% $
So the $20\% $ less popular colours should be
$ \Rightarrow 26 - 5.2$
$ \Rightarrow 20.8\% $
We can see all the other cars in the pie chart given have values less than the $20.8\% $ and thus we can say all the colours of the cars are $20\% $ less popular than the white coloured car.
Note:
The chart given is a pie chart. The whole angle of a pie chart is equal to the complete angle of a circle which is ${360^ \circ }$. The central angle of any component is the angle of the pie occupied by a component. The central angle ($C.A.$ ) can be calculated using the formula:
$C.A. = \dfrac{P}{{100}} \times 360$,
Where $P$ is the percentage of pie occupied by a component.
Recently Updated Pages
Master Class 11 Computer Science: Engaging Questions & Answers for Success
Master Class 11 Business Studies: Engaging Questions & Answers for Success
Master Class 11 Economics: Engaging Questions & Answers for Success
Master Class 11 English: Engaging Questions & Answers for Success
Master Class 11 Maths: Engaging Questions & Answers for Success
Master Class 11 Biology: Engaging Questions & Answers for Success
Trending doubts
One Metric ton is equal to kg A 10000 B 1000 C 100 class 11 physics CBSE
There are 720 permutations of the digits 1 2 3 4 5 class 11 maths CBSE
Discuss the various forms of bacteria class 11 biology CBSE
Draw a diagram of a plant cell and label at least eight class 11 biology CBSE
State the laws of reflection of light
Explain zero factorial class 11 maths CBSE