


How many students spent more than 5 hours watching TV?
(a) 20
(b) 24
(c) 12
(d) 14
Answer
516.6k+ views
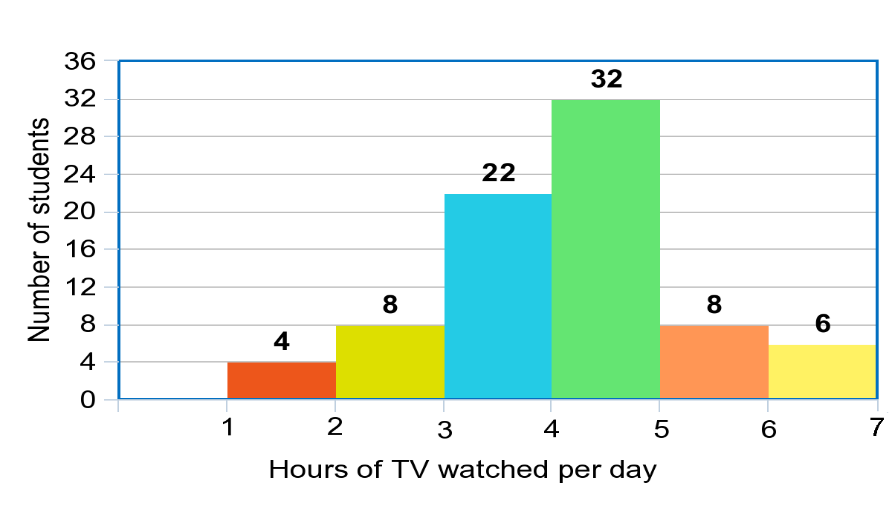
Hint: We can find the number of students that spent more than 5 hours watching TV by looking into the -axis and the corresponding values in the Y-axis. From the graph, we have to add the number of students that watched TV for 5-6 hours and 6-7 hours. These values are obtained from the Y-axis.
Complete step by step answer:
We are given a histogram that shows the number of students that watched TV for some hours per day. We have to find the number of students that spent more than 5 hours watching TV. Let us recollect how to read data from a histogram. We know that a histogram is a graphical display of data using bars of different heights where each bar groups numbers into ranges. The taller bars indicate that more data falls in that range. We can read the data in a histogram by looking into the data on the X-axis and the corresponding values in the Y-axis. The X-axis shows the class intervals while the Y-axis shows the values corresponding to the class interval.
To find the number of students that spent more than 5 hours watching TV, we have to look into the X-axis for the intervals from 5-6 and 6-7. We have to add the corresponding Y-axis values. We can see that 8 students watched TV for 5-6 hours and 6 students watched TV for 6-7 hours.
Therefore, number of students that spent more than 5 hours in watching TV $=8+6=14$
So, the correct answer is “Option d”.
Note: Students must read the histogram carefully as there can be a chance of making a mistake when reading the Y-axis values. They have a chance of misinterpreting the X-axis values by not considering them as class intervals.

Recently Updated Pages
Master Class 8 Social Science: Engaging Questions & Answers for Success
Master Class 8 English: Engaging Questions & Answers for Success
Class 8 Question and Answer - Your Ultimate Solutions Guide
Master Class 8 Maths: Engaging Questions & Answers for Success
Master Class 8 Science: Engaging Questions & Answers for Success
Master Class 9 General Knowledge: Engaging Questions & Answers for Success
Trending doubts
What is BLO What is the full form of BLO class 8 social science CBSE
Citizens of India can vote at the age of A 18 years class 8 social science CBSE
Full form of STD, ISD and PCO
Advantages and disadvantages of science
Right to vote is a AFundamental Right BFundamental class 8 social science CBSE
What are the 12 elements of nature class 8 chemistry CBSE