


How do you solve \[y = \dfrac{1}{2}x\] , \[y = - x + 3\] by graphing?
Answer
528.3k+ views
Hint: Here in this question, we have to find the value of \[x\] and \[y\] using the graphical method. For this we have to plot a graph for the both the linear equations by finding the coordinates of both the equations. If lines of the two linear equations intersect in a single point in the graph. That point shows the required value.
Complete step by step solution:
The linear equation in the form of \[ax + by + c = 0\] . Where \[x\] and \[y\] are variables.
Consider the given two linear equation:
\[ \Rightarrow y = \dfrac{1}{2}x\] --------(1)
\[ \Rightarrow y = - x + 3\] ------(2)
Now finding the coordinates of both equations, by giving the x values 0, 1, 2, 3, … simultaneously we get the values of y.
Consider Equation (1)
\[ \Rightarrow y = \dfrac{1}{2}x\]
Put x=0
Then \[ \Rightarrow y = \dfrac{1}{2}\left( 0 \right)\]
\[\therefore y = 0\]
Therefore, co-ordinate \[\left( {x,y} \right) = \left( {0,0} \right)\]
Put x=2
\[ \Rightarrow y = \dfrac{1}{2}\left( 2 \right)\]
\[\therefore y = 1\]
Therefore, co-ordinate \[\left( {x,y} \right) = \left( {2,1} \right)\]
The coordinates of \[y = \dfrac{1}{2}x\] represent in table as :
Now, consider Equation (2)
\[ \Rightarrow y = - x + 3\]
Put x=0
Then \[ \Rightarrow y = - \left( 0 \right) + 3\]
\[\therefore y = 3\]
Therefore, co-ordinate \[\left( {x,y} \right) = \left( {0,0} \right)\]
Put x=3
\[ \Rightarrow y = - 3 + 3\]
\[\therefore y = 0\]
Therefore, co-ordinate \[\left( {x,y} \right) = \left( {3,0} \right)\]
The coordinates of \[y = - x + 3\] represent in table as :
Now, the graph of the given two linear equations \[y = \dfrac{1}{2}x\] and \[y = - x + 3\] by using the above two table as follows:
In the graph two lines of linear equations \[y = \dfrac{1}{2}x\] and \[y = - x + 3\] are intersect at the point \[\left( {2,1} \right)\] .
Hence, the value of \[x = 2\] and \[y = 1\] .
This can be verify by applying a resultant value of x and y in either one of the equation if its’s satisfy LHS=RHS, then the resultant value are correct.
Consider equation (1)
\[ \Rightarrow y = \dfrac{1}{2}x\]
Substitute \[x = 2\] and \[y = 1\] , then
\[ \Rightarrow 1 = \dfrac{1}{2}\left( 2 \right)\]
On simplification, we get
\[ \Rightarrow 1 = 1\]
LHS=RHS
Hence, the above solutions are correct.
Note: When finding the solutions of linear equation using the graphical method we have to know the three following points: In graph
The lines may intersect in a single point. In this case, the pair of equations has a unique solution (consistent pair of equations).
The lines may be parallel. In this case, the equations have no solution (inconsistent pair of equations).
The lines may be coincident. In this case, the equations have infinitely many solutions [dependent (consistent) pair of equations] .
Complete step by step solution:
The linear equation in the form of \[ax + by + c = 0\] . Where \[x\] and \[y\] are variables.
Consider the given two linear equation:
\[ \Rightarrow y = \dfrac{1}{2}x\] --------(1)
\[ \Rightarrow y = - x + 3\] ------(2)
Now finding the coordinates of both equations, by giving the x values 0, 1, 2, 3, … simultaneously we get the values of y.
Consider Equation (1)
\[ \Rightarrow y = \dfrac{1}{2}x\]
Put x=0
Then \[ \Rightarrow y = \dfrac{1}{2}\left( 0 \right)\]
\[\therefore y = 0\]
Therefore, co-ordinate \[\left( {x,y} \right) = \left( {0,0} \right)\]
Put x=2
\[ \Rightarrow y = \dfrac{1}{2}\left( 2 \right)\]
\[\therefore y = 1\]
Therefore, co-ordinate \[\left( {x,y} \right) = \left( {2,1} \right)\]
The coordinates of \[y = \dfrac{1}{2}x\] represent in table as :
| \[x\] | \[0\] | \[2\] |
| \[y = \dfrac{1}{2}x\] | \[0\] | \[1\] |
| \[\left( {x,y} \right)\] | \[\left( {0,0} \right)\] | \[\left( {2,1} \right)\] |
Now, consider Equation (2)
\[ \Rightarrow y = - x + 3\]
Put x=0
Then \[ \Rightarrow y = - \left( 0 \right) + 3\]
\[\therefore y = 3\]
Therefore, co-ordinate \[\left( {x,y} \right) = \left( {0,0} \right)\]
Put x=3
\[ \Rightarrow y = - 3 + 3\]
\[\therefore y = 0\]
Therefore, co-ordinate \[\left( {x,y} \right) = \left( {3,0} \right)\]
The coordinates of \[y = - x + 3\] represent in table as :
| \[x\] | \[0\] | \[3\] |
| \[y = - x + 3\] | \[3\] | \[0\] |
| \[\left( {x,y} \right)\] | \[\left( {0,3} \right)\] | \[\left( {3,0} \right)\] |
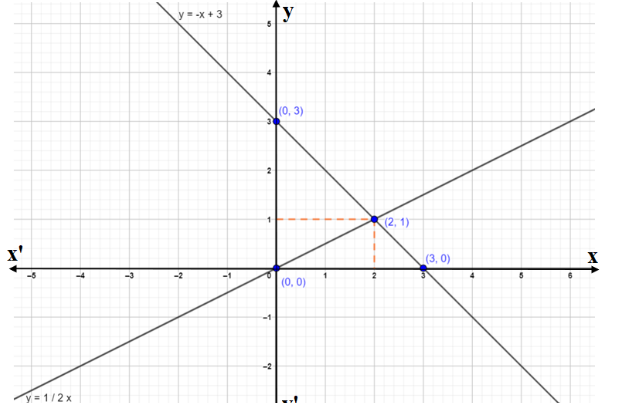
Now, the graph of the given two linear equations \[y = \dfrac{1}{2}x\] and \[y = - x + 3\] by using the above two table as follows:
In the graph two lines of linear equations \[y = \dfrac{1}{2}x\] and \[y = - x + 3\] are intersect at the point \[\left( {2,1} \right)\] .
Hence, the value of \[x = 2\] and \[y = 1\] .
This can be verify by applying a resultant value of x and y in either one of the equation if its’s satisfy LHS=RHS, then the resultant value are correct.
Consider equation (1)
\[ \Rightarrow y = \dfrac{1}{2}x\]
Substitute \[x = 2\] and \[y = 1\] , then
\[ \Rightarrow 1 = \dfrac{1}{2}\left( 2 \right)\]
On simplification, we get
\[ \Rightarrow 1 = 1\]
LHS=RHS
Hence, the above solutions are correct.
Note: When finding the solutions of linear equation using the graphical method we have to know the three following points: In graph
The lines may intersect in a single point. In this case, the pair of equations has a unique solution (consistent pair of equations).
The lines may be parallel. In this case, the equations have no solution (inconsistent pair of equations).
The lines may be coincident. In this case, the equations have infinitely many solutions [dependent (consistent) pair of equations] .

Recently Updated Pages
Master Class 8 Social Science: Engaging Questions & Answers for Success
Master Class 8 English: Engaging Questions & Answers for Success
Class 8 Question and Answer - Your Ultimate Solutions Guide
Master Class 8 Maths: Engaging Questions & Answers for Success
Master Class 8 Science: Engaging Questions & Answers for Success
Master Class 7 English: Engaging Questions & Answers for Success
Trending doubts
Convert 40circ C to Fahrenheit A 104circ F B 107circ class 8 maths CBSE
What are the 12 elements of nature class 8 chemistry CBSE
What is the difference between rai and mustard see class 8 biology CBSE
When people say No pun intended what does that mea class 8 english CBSE
Write a letter to the Municipal Commissioner to inform class 8 english CBSE
Explain the role of the opposition party in a demo class 8 social studies CBSE