


How do you solve the inequality 7 + 2p < -14?
Answer
597.3k+ views
Hint: In this problem, we need to represent the linear inequality graphically. Basically linear inequality is an inequality which involves linear function. It also contains the symbols of inequality like in the question, there is a use of ‘lesser than’ symbol. Therefore it shows the data which is not equal in graph form.
Complete step-by-step answer:
Now, let’s discuss the question in detail.
As we already know about linear equations. Linear equations are generally in one variable and two variables. So, linear inequality is nothing but a linear equation in one or two variables such as y = 2x+1. But it will have an inequality like $>,<,\ge ,\le $.We represent the particular inequality in a graph by shading that portion. Therefore it shows the data which is not equal.
There are some steps which have to be followed while plotting the linear inequalities. First step is to rearrange the equation such that the variable comes at the left and the rest of the terms comes to the right. Next step is to plot that equation on the graph. For example if an equation is given: $y\le 2x-1$. In this, we need to plot the line for y = 2x – 1. And further we have to shade the area in which ‘y’ is less than 2x – 1. That’s all we need to do.
Let’s perform all the steps for 7 + 2p < -14.
Take all the terms one by one on the right hand side:
$\Rightarrow $2p < -14 -7
$\Rightarrow $2p < -21
Keep ‘p’ alone:
$\Rightarrow $p < $\dfrac{-21}{2}$
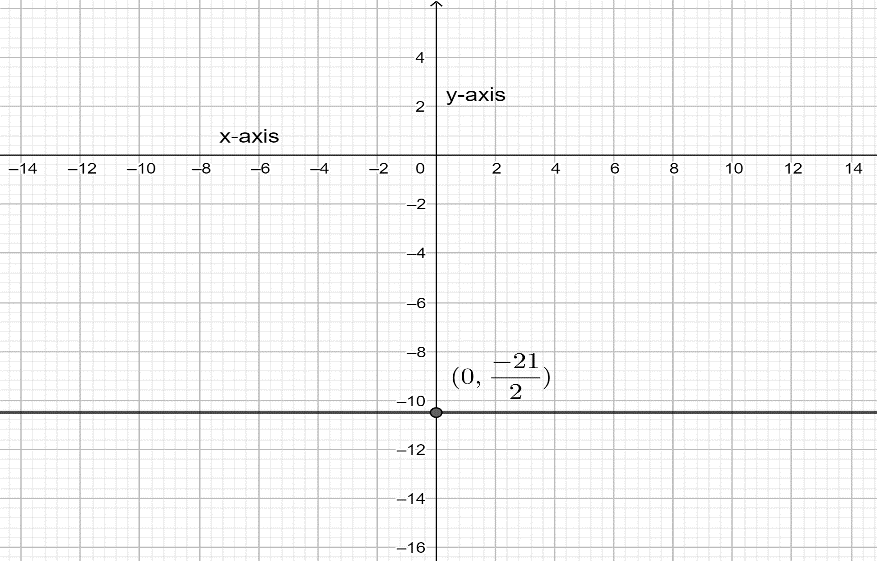
This graph is for y = -$\dfrac{21}{2}$. This show the line without an inequality.
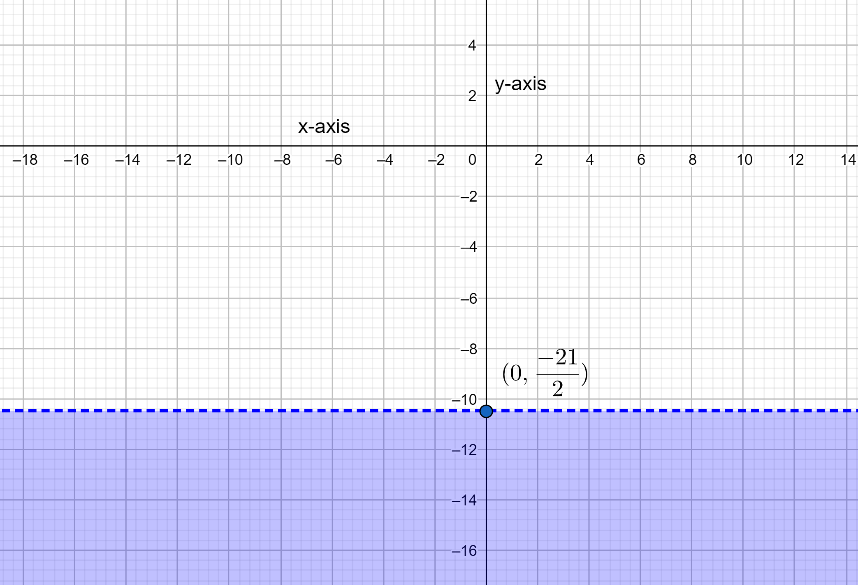
This is the graph of the inequality p < $\dfrac{-21}{2}$. This inequality is represented by the shaded portion.
Note: If you start plotting the equations directly from the question without solving them, then you will not be able to represent any equation properly and face many errors. For graphs which are related to inequalities, you need to move step by step and don’t forget to shade the area covered under that equation.
Complete step-by-step answer:
Now, let’s discuss the question in detail.
As we already know about linear equations. Linear equations are generally in one variable and two variables. So, linear inequality is nothing but a linear equation in one or two variables such as y = 2x+1. But it will have an inequality like $>,<,\ge ,\le $.We represent the particular inequality in a graph by shading that portion. Therefore it shows the data which is not equal.
There are some steps which have to be followed while plotting the linear inequalities. First step is to rearrange the equation such that the variable comes at the left and the rest of the terms comes to the right. Next step is to plot that equation on the graph. For example if an equation is given: $y\le 2x-1$. In this, we need to plot the line for y = 2x – 1. And further we have to shade the area in which ‘y’ is less than 2x – 1. That’s all we need to do.
Let’s perform all the steps for 7 + 2p < -14.
Take all the terms one by one on the right hand side:
$\Rightarrow $2p < -14 -7
$\Rightarrow $2p < -21
Keep ‘p’ alone:
$\Rightarrow $p < $\dfrac{-21}{2}$
This graph is for y = -$\dfrac{21}{2}$. This show the line without an inequality.
This is the graph of the inequality p < $\dfrac{-21}{2}$. This inequality is represented by the shaded portion.
Note: If you start plotting the equations directly from the question without solving them, then you will not be able to represent any equation properly and face many errors. For graphs which are related to inequalities, you need to move step by step and don’t forget to shade the area covered under that equation.
Recently Updated Pages
Master Class 11 English: Engaging Questions & Answers for Success
Master Class 11 Social Science: Engaging Questions & Answers for Success
Master Class 11 Maths: Engaging Questions & Answers for Success
Master Class 11 Biology: Engaging Questions & Answers for Success
Master Class 11 Physics: Engaging Questions & Answers for Success
Master Class 11 Chemistry: Engaging Questions & Answers for Success
Trending doubts
Explain the Treaty of Vienna of 1815 class 10 social science CBSE
What is the Total Duration of Football Match?
First Cotton Mill of India
In which year voting age was reduced from 21 to 18?
10 examples of evaporation in daily life with explanations
What planets have no moons Which one has only one moon class 10 physics CBSE