


Solve the given inequalities graphically: $x + 2y \leqslant 10$, $x + y \geqslant 1$, $x - y \leqslant 0$, $x \geqslant 0$, $y \geqslant 0$.
Answer
537.9k+ views
Hint: Here, in the given question, we need to draw the graphical solution of the given inequalities. Firstly, we will convert the inequalities into equations. Then, we will find out the points through which the line passes and draw a graph including all the line equations given in the conditions. The darkest shaded region will be our graphical solution of the given inequalities.
Complete step-by-step solution:
First we solve $x + 2y \leqslant 10$
Let us first draw graph of $x + 2y = 10....\left( i \right)$
On putting $x = 0$ in $\left( i \right)$, we get
$ \Rightarrow 0 + 2y = 10$
$ \Rightarrow 2y = 10$
On canceling common factors, we get
$ \Rightarrow y = 5$
On putting $y = 0$ in $\left( i \right)$, we get
$ \Rightarrow x + 2 \times 0 = 10$
$ \Rightarrow x = 10$
Therefore, points to be plotted are: $\left( {0,5} \right)$ and $\left( {10,0} \right)$.
Checking for $\left( {0,0} \right)$. Putting $x = 0$ and $y = 0$
$ \Rightarrow x + 2y \leqslant 10$
$ \Rightarrow 0 \leqslant 10$
Which is true. Hence the solution set of $x + 2y \leqslant 10$ is the region in the $xy$ plane which contains the origin. Inequality $\left( i \right)$ represents the region below the line.
Now we solve $x + y \geqslant 1$
Let us first draw graph of $x + y = 1.....\left( {ii} \right)$
On putting $x = 0$ in $\left( {ii} \right)$, we get
$ \Rightarrow 0 + y = 1$
$ \Rightarrow y = 1$
On putting $y = 0$ in $\left( {ii} \right)$, we get
$ \Rightarrow x + 0 = 1$
$ \Rightarrow x = 1$
Therefore, points to be plotted are: $\left( {0,1} \right)$ and $\left( {1,0} \right)$.
Checking for $\left( {0,0} \right)$. Putting $x = 0$ and $y = 0$
$ \Rightarrow x + y \geqslant 1$
$ \Rightarrow 0 \geqslant 1$
Which is false. Hence the region in the $xy$ plane which does not contain the origin represents the solution set of this inequation. Inequality $\left( {ii} \right)$ represents the region above the line.
Now we solve $x - y \leqslant 0$
Let us first draw graph of $.x - y = 0....\left( {iii} \right)$
On putting $x = 0$ in $\left( {ii} \right)$, we get
$ \Rightarrow 0 - y = 0$
$ \Rightarrow y = 0$
On putting $y = 2$ in $\left( {ii} \right)$, we get
$ \Rightarrow x - 2 = 0$
$ \Rightarrow x = 2$
Therefore, points to be plotted are: $\left( {0,0} \right)$ and $\left( {2,2} \right)$.
As we can see, here origin lies on the line. To check which side of line would be included in the solution area we will check for the point $\left( {10,0} \right)$
Checking for $\left( {10,0} \right)$. Putting $x = 10$ and $y = 0$
$ \Rightarrow x - y \leqslant 0$
$ \Rightarrow 10 - 0 \leqslant 0$
$ \Rightarrow 10 \leqslant 0$
Which is false. Hence, inequality $\left( {iii} \right)$ represents the region above the line.
For $x \geqslant 0$, $y \geqslant 0$,
Since both $x$ and $y$ are greater than $0$, the solution area would be in the 1st quadrant.
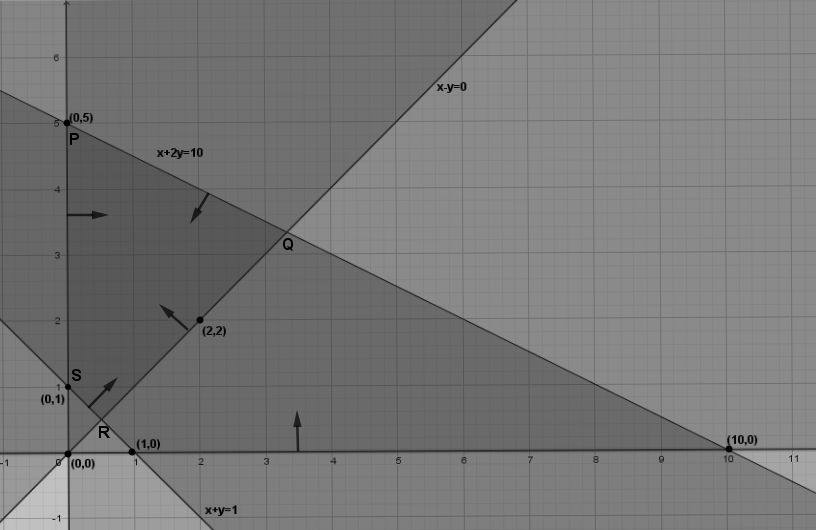
Now we will plot the graph which contains the given inequalities:
Hence, the solution area for the given inequalities would be the darkest shaded region i.e., region PQRS of the graph satisfying all the given inequalities.
Note: Always choose a point which doesn’t lie on the same line, if possible choose $\left( {0,0} \right)$, then substitute its coordinates in the inequation to check which region should be shaded. Here, in the given question, we are given inequalities with $ \leqslant $ or $ \geqslant $ symbols, so we plotted a solid line. But inequalities that use $ < $ or $ > $ symbols are plotted with a dashed line to show that the line is not included in the region.
Complete step-by-step solution:
First we solve $x + 2y \leqslant 10$
Let us first draw graph of $x + 2y = 10....\left( i \right)$
On putting $x = 0$ in $\left( i \right)$, we get
$ \Rightarrow 0 + 2y = 10$
$ \Rightarrow 2y = 10$
On canceling common factors, we get
$ \Rightarrow y = 5$
On putting $y = 0$ in $\left( i \right)$, we get
$ \Rightarrow x + 2 \times 0 = 10$
$ \Rightarrow x = 10$
Therefore, points to be plotted are: $\left( {0,5} \right)$ and $\left( {10,0} \right)$.
Checking for $\left( {0,0} \right)$. Putting $x = 0$ and $y = 0$
$ \Rightarrow x + 2y \leqslant 10$
$ \Rightarrow 0 \leqslant 10$
Which is true. Hence the solution set of $x + 2y \leqslant 10$ is the region in the $xy$ plane which contains the origin. Inequality $\left( i \right)$ represents the region below the line.
Now we solve $x + y \geqslant 1$
Let us first draw graph of $x + y = 1.....\left( {ii} \right)$
On putting $x = 0$ in $\left( {ii} \right)$, we get
$ \Rightarrow 0 + y = 1$
$ \Rightarrow y = 1$
On putting $y = 0$ in $\left( {ii} \right)$, we get
$ \Rightarrow x + 0 = 1$
$ \Rightarrow x = 1$
Therefore, points to be plotted are: $\left( {0,1} \right)$ and $\left( {1,0} \right)$.
Checking for $\left( {0,0} \right)$. Putting $x = 0$ and $y = 0$
$ \Rightarrow x + y \geqslant 1$
$ \Rightarrow 0 \geqslant 1$
Which is false. Hence the region in the $xy$ plane which does not contain the origin represents the solution set of this inequation. Inequality $\left( {ii} \right)$ represents the region above the line.
Now we solve $x - y \leqslant 0$
Let us first draw graph of $.x - y = 0....\left( {iii} \right)$
On putting $x = 0$ in $\left( {ii} \right)$, we get
$ \Rightarrow 0 - y = 0$
$ \Rightarrow y = 0$
On putting $y = 2$ in $\left( {ii} \right)$, we get
$ \Rightarrow x - 2 = 0$
$ \Rightarrow x = 2$
Therefore, points to be plotted are: $\left( {0,0} \right)$ and $\left( {2,2} \right)$.
As we can see, here origin lies on the line. To check which side of line would be included in the solution area we will check for the point $\left( {10,0} \right)$
Checking for $\left( {10,0} \right)$. Putting $x = 10$ and $y = 0$
$ \Rightarrow x - y \leqslant 0$
$ \Rightarrow 10 - 0 \leqslant 0$
$ \Rightarrow 10 \leqslant 0$
Which is false. Hence, inequality $\left( {iii} \right)$ represents the region above the line.
For $x \geqslant 0$, $y \geqslant 0$,
Since both $x$ and $y$ are greater than $0$, the solution area would be in the 1st quadrant.
Now we will plot the graph which contains the given inequalities:
Hence, the solution area for the given inequalities would be the darkest shaded region i.e., region PQRS of the graph satisfying all the given inequalities.
Note: Always choose a point which doesn’t lie on the same line, if possible choose $\left( {0,0} \right)$, then substitute its coordinates in the inequation to check which region should be shaded. Here, in the given question, we are given inequalities with $ \leqslant $ or $ \geqslant $ symbols, so we plotted a solid line. But inequalities that use $ < $ or $ > $ symbols are plotted with a dashed line to show that the line is not included in the region.
Recently Updated Pages
Master Class 11 English: Engaging Questions & Answers for Success
Master Class 11 Social Science: Engaging Questions & Answers for Success
Master Class 11 Maths: Engaging Questions & Answers for Success
Master Class 11 Biology: Engaging Questions & Answers for Success
Master Class 11 Physics: Engaging Questions & Answers for Success
Master Class 11 Chemistry: Engaging Questions & Answers for Success
Trending doubts
One Metric ton is equal to kg A 10000 B 1000 C 100 class 11 physics CBSE
Difference Between Prokaryotic Cells and Eukaryotic Cells
Find the value of the expression given below sin 30circ class 11 maths CBSE
Difference between physical and chemical change class 11 chemistry CBSE
Two of the body parts which do not appear in MRI are class 11 biology CBSE
Draw a diagram of a plant cell and label at least eight class 11 biology CBSE