


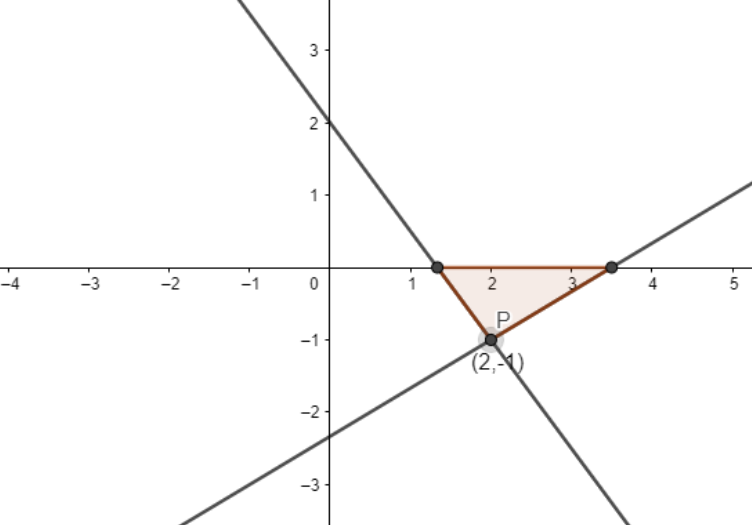
Solve the following system of linear equations graphically. \[3x + 2y - 4 = 0\] and \[2x - 3y - 7 = 0\]. Shade the region bounded by the lines and the x-axis.
Answer
497.1k+ views
Hint: Solve the two equations by putting \[x = 0\] and find value for \[y\] and then putting \[y = 0\] and finding value of \[x\]. You will get two points for each equation respectively. Draw the tables showing the respective points for both the equations separately and then mark them on the graph.
Complete step-by-step solution:
We are given the equations:
\[3x + 2y - 4 = 0\] … (1)
\[2x - 3y - 7 = 0\] … (2)
Now putting \[x = 0\] in equation (1) we get
\[3 \times 0 + 2y - 4 = 0\]
Hence we get
\[2y - 4 = 0\]
Taking the constant term to another side we get
\[2y = 4\]
Dividing both sides by \[2\] we get
\[y = 2\]
Therefore we get \[x = 0,y = 2\]
Now putting \[y = 0\] in equation (1) we get
\[3x + 2 \times 0 - 4 = 0\]
Hence we get
\[3x - 4 = 0\]
Taking the constant term to another side we get
\[3x = 4\]
Dividing both sides by \[3\] we get
\[x = \dfrac{4}{3}\]
Therefore we get \[x = \dfrac{4}{3},y = 0\]
Use the following table to draw the graph:
The graph of (1) can be obtained by plotting the two points \[A(0,2),B\left( {\dfrac{4}{3},0} \right)\]
Now putting \[x = 0\]in equation (2) we get
\[2 \times 0 - 3y - 7 = 0\]
Hence we get
\[ - 3y - 7 = 0\]
Taking the constant term to another side we get
\[ - 3y = 7\]
Dividing both sides by \[ - 3\] we get
\[y = - \dfrac{7}{3}\]
Therefore we get \[x = 0,y = - \dfrac{7}{3}\]
Now putting \[y = 0\] in equation (2) we get
\[2x - 3 \times 0 - 7 = 0\]
Hence we get
\[2x - 7 = 0\]
Taking the constant term to another side we get
\[2x = 7\]
Dividing both sides by \[2\] we get
\[x = \dfrac{7}{2}\]
Therefore we get \[x = \dfrac{7}{2},y = 0\]
Use the following table to draw the graph:
The graph of (2) can be obtained by plotting the two points \[C\left( {0, - \dfrac{7}{3}} \right),D\left( {\dfrac{7}{2},0} \right)\]
Note: A single linear equation in two variables may have infinite solutions. A pair of linear equations can have no solution, a unique solution and infinitely many solutions depending upon the conditions of the coefficients of the variables. The general form of a linear equation in two variables is $ax + by + c = 0$. If \[\dfrac{{{a_1}}}{{{a_2}}} = \dfrac{{{b_1}}}{{{b_2}}} = \dfrac{{{c_1}}}{{{c_2}}}\], then the two equations have infinitely many solutions. If \[\dfrac{{{a_1}}}{{{a_2}}} = \dfrac{{{b_1}}}{{{b_2}}} \ne \dfrac{{{c_1}}}{{{c_2}}}\], then the two lines have no solution at all. If \[\dfrac{{{a_1}}}{{{a_2}}} \ne \dfrac{{{b_1}}}{{{b_2}}}\], the two equations have a unique solution.
Complete step-by-step solution:
We are given the equations:
\[3x + 2y - 4 = 0\] … (1)
\[2x - 3y - 7 = 0\] … (2)
Now putting \[x = 0\] in equation (1) we get
\[3 \times 0 + 2y - 4 = 0\]
Hence we get
\[2y - 4 = 0\]
Taking the constant term to another side we get
\[2y = 4\]
Dividing both sides by \[2\] we get
\[y = 2\]
Therefore we get \[x = 0,y = 2\]
Now putting \[y = 0\] in equation (1) we get
\[3x + 2 \times 0 - 4 = 0\]
Hence we get
\[3x - 4 = 0\]
Taking the constant term to another side we get
\[3x = 4\]
Dividing both sides by \[3\] we get
\[x = \dfrac{4}{3}\]
Therefore we get \[x = \dfrac{4}{3},y = 0\]
Use the following table to draw the graph:
| x | \[0\] | \[\dfrac{4}{3}\] |
| y | \[2\] | \[0\] |
The graph of (1) can be obtained by plotting the two points \[A(0,2),B\left( {\dfrac{4}{3},0} \right)\]
Now putting \[x = 0\]in equation (2) we get
\[2 \times 0 - 3y - 7 = 0\]
Hence we get
\[ - 3y - 7 = 0\]
Taking the constant term to another side we get
\[ - 3y = 7\]
Dividing both sides by \[ - 3\] we get
\[y = - \dfrac{7}{3}\]
Therefore we get \[x = 0,y = - \dfrac{7}{3}\]
Now putting \[y = 0\] in equation (2) we get
\[2x - 3 \times 0 - 7 = 0\]
Hence we get
\[2x - 7 = 0\]
Taking the constant term to another side we get
\[2x = 7\]
Dividing both sides by \[2\] we get
\[x = \dfrac{7}{2}\]
Therefore we get \[x = \dfrac{7}{2},y = 0\]
Use the following table to draw the graph:
| X | \[0\] | \[\dfrac{7}{2}\] |
| y | \[ - \dfrac{7}{3}\] | \[0\] |
The graph of (2) can be obtained by plotting the two points \[C\left( {0, - \dfrac{7}{3}} \right),D\left( {\dfrac{7}{2},0} \right)\]
Note: A single linear equation in two variables may have infinite solutions. A pair of linear equations can have no solution, a unique solution and infinitely many solutions depending upon the conditions of the coefficients of the variables. The general form of a linear equation in two variables is $ax + by + c = 0$. If \[\dfrac{{{a_1}}}{{{a_2}}} = \dfrac{{{b_1}}}{{{b_2}}} = \dfrac{{{c_1}}}{{{c_2}}}\], then the two equations have infinitely many solutions. If \[\dfrac{{{a_1}}}{{{a_2}}} = \dfrac{{{b_1}}}{{{b_2}}} \ne \dfrac{{{c_1}}}{{{c_2}}}\], then the two lines have no solution at all. If \[\dfrac{{{a_1}}}{{{a_2}}} \ne \dfrac{{{b_1}}}{{{b_2}}}\], the two equations have a unique solution.
Recently Updated Pages
Master Class 10 Computer Science: Engaging Questions & Answers for Success
Master Class 10 General Knowledge: Engaging Questions & Answers for Success
Master Class 10 English: Engaging Questions & Answers for Success
Master Class 10 Social Science: Engaging Questions & Answers for Success
Master Class 10 Maths: Engaging Questions & Answers for Success
Master Class 10 Science: Engaging Questions & Answers for Success
Trending doubts
What is the median of the first 10 natural numbers class 10 maths CBSE
Which women's tennis player has 24 Grand Slam singles titles?
Who is the Brand Ambassador of Incredible India?
Why is there a time difference of about 5 hours between class 10 social science CBSE
Write a letter to the principal requesting him to grant class 10 english CBSE
A moving boat is observed from the top of a 150 m high class 10 maths CBSE