


Solve the following system of inequalities graphically $x + y \leqslant 9,y > x,x \geqslant 0$.
Answer
613.2k+ views
Hit – In this question plot the different inequalities given onto a single graph paper. First plot the straight line x + y=9, then a straight line passing through origin x=y and then search for the portion on graph for which $x \geqslant 0$ satisfies. Find the points of intersection and mark the regions that satisfy individual inequality, find the region in common.
Complete step-by-step solution -
Given system of inequalities
$x + y \leqslant 9,y > x,x \geqslant 0$
Now we have to solve these inequalities graphically.
So plot these inequalities as above.
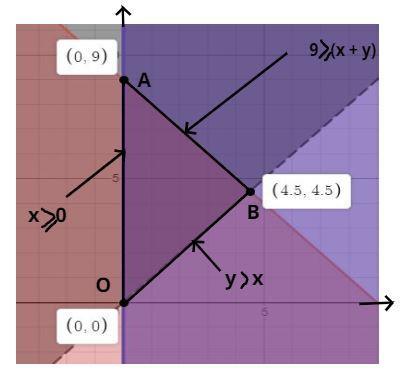
So the solution of these inequalities is a triangle OAB as shown in figure.
Whose coordinates are also shown in the above figure.
The solution of $x + y \leqslant 9,y > x$ is point B whose coordinates is (4.5, 4.5).
We can also solve this manually when inequalities hold the equation becomes
x + y = 9 and y = x
$ \Rightarrow 2x = 9$
$ \Rightarrow x = \dfrac{9}{2} = 4.5 = y$
So the coordinates of point B is (4.5, 4.5)
The solution of $x + y \leqslant 9,x \geqslant 0$ is point A whose coordinates is (0, 9).
We can also solve this manually when inequalities hold the equation becomes
x + y = 9 and x = 0
$ \Rightarrow 0 + y = 9$
$ \Rightarrow y = 9$
So the coordinates of point A is (0, 9).
The solution of $y > x,x \geqslant 0$ is point O whose coordinates is (0, 0).
We can also solve this manually when inequalities hold the equation becomes
y = x and x = 0
$ \Rightarrow y = x = 0$
So the coordinates of point O is (0, 0).
So this is the required solution of the system of inequalities.
Note – The graphical plotting of inequalities is mandatory while solving problems of this kind. Here the question arise that why have we plotted x + y=9 and y=x although we needed to solve $x + y \leqslant 9,y > x$, this is because the inequality depicts area however the line depicts the boundary of this area, thus to track this area its boundary needs to be sketched.
Complete step-by-step solution -
Given system of inequalities
$x + y \leqslant 9,y > x,x \geqslant 0$
Now we have to solve these inequalities graphically.
So plot these inequalities as above.
So the solution of these inequalities is a triangle OAB as shown in figure.
Whose coordinates are also shown in the above figure.
The solution of $x + y \leqslant 9,y > x$ is point B whose coordinates is (4.5, 4.5).
We can also solve this manually when inequalities hold the equation becomes
x + y = 9 and y = x
$ \Rightarrow 2x = 9$
$ \Rightarrow x = \dfrac{9}{2} = 4.5 = y$
So the coordinates of point B is (4.5, 4.5)
The solution of $x + y \leqslant 9,x \geqslant 0$ is point A whose coordinates is (0, 9).
We can also solve this manually when inequalities hold the equation becomes
x + y = 9 and x = 0
$ \Rightarrow 0 + y = 9$
$ \Rightarrow y = 9$
So the coordinates of point A is (0, 9).
The solution of $y > x,x \geqslant 0$ is point O whose coordinates is (0, 0).
We can also solve this manually when inequalities hold the equation becomes
y = x and x = 0
$ \Rightarrow y = x = 0$
So the coordinates of point O is (0, 0).
So this is the required solution of the system of inequalities.
Note – The graphical plotting of inequalities is mandatory while solving problems of this kind. Here the question arise that why have we plotted x + y=9 and y=x although we needed to solve $x + y \leqslant 9,y > x$, this is because the inequality depicts area however the line depicts the boundary of this area, thus to track this area its boundary needs to be sketched.
Recently Updated Pages
Master Class 11 Computer Science: Engaging Questions & Answers for Success
Master Class 11 Business Studies: Engaging Questions & Answers for Success
Master Class 11 Economics: Engaging Questions & Answers for Success
Master Class 11 English: Engaging Questions & Answers for Success
Master Class 11 Maths: Engaging Questions & Answers for Success
Master Class 11 Biology: Engaging Questions & Answers for Success
Trending doubts
One Metric ton is equal to kg A 10000 B 1000 C 100 class 11 physics CBSE
There are 720 permutations of the digits 1 2 3 4 5 class 11 maths CBSE
Discuss the various forms of bacteria class 11 biology CBSE
Draw a diagram of a plant cell and label at least eight class 11 biology CBSE
State the laws of reflection of light
Explain zero factorial class 11 maths CBSE