


How do you solve for y and graph y+2x=3?
Answer
596.7k+ views
Hint: This type of question is based on the concept of linear equations with two variables. We have to first consider the given equation and subtract 2x from both the sides of the equation to solve y. Then, substitute y=0 and find the value of x. Similarly, substitute x=0 and find the value of y. Therefore, we get the x-intercept and y-intercept of the given linear equation. Plot the x and y intercepts in a graph and joins the two points with a line. Thus, we have plotted the graph for y+2x=3.
Complete step-by-step solution:
According to the question, we are asked to solve for y and graphs of y+2x=3.
We have been given the equation is y+2x=3. ----------(1)
First, we have to consider the equation (1).
Subtract 2x from both the sides of the equation. We get
y+2x-2x=3-2x
We know that the terms with the same magnitude and opposite signs cancel out.
Therefore, y=3-2x
Now, we have to plot a graph for y+2x=3.
Since it is a linear equation with two variables, find the intercepts are enough to plot the graph.
To find the x-intercept, we have to substitute y=0.
0+2x=3
\[\Rightarrow 2x=3\]
Divide the whole expression by 2. We get
\[\Rightarrow \dfrac{2x}{2}=\dfrac{3}{2}\]
Cancelling out the common term 2 from the LHS, we get
\[x=\dfrac{3}{2}\]
Therefore, the x-intercept is \[\dfrac{3}{2}\] and the point is \[\left( \dfrac{3}{2},0 \right)\].
Now, we have to find the y-intercept.
Substitute x=0. We get,
y+0=3
Therefore, y=3.
Hence, the y-intercept is 3 and the point is (0,3).
Plot the points \[\left( \dfrac{3}{2},0 \right)\] and (0,3) in the graph.
Join the two points with a straight line.
We get
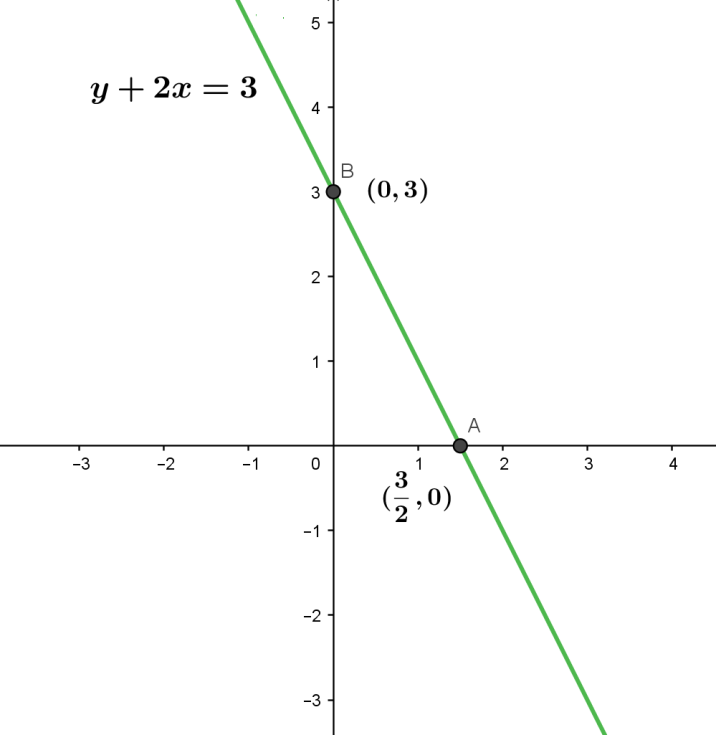
Therefore, the value of y in y+2x=3 is 3-2x and the graph of y+2x=3 is obtained.
Note: We should simply draw straight lines between the two points. Since the given equation is a linear equation, the graph will always be a straight line. It is enough to just find the x and y intercepts and plot a graph with those points. Avoid calculation mistakes based on finding the values of the intercepts.
Complete step-by-step solution:
According to the question, we are asked to solve for y and graphs of y+2x=3.
We have been given the equation is y+2x=3. ----------(1)
First, we have to consider the equation (1).
Subtract 2x from both the sides of the equation. We get
y+2x-2x=3-2x
We know that the terms with the same magnitude and opposite signs cancel out.
Therefore, y=3-2x
Now, we have to plot a graph for y+2x=3.
Since it is a linear equation with two variables, find the intercepts are enough to plot the graph.
To find the x-intercept, we have to substitute y=0.
0+2x=3
\[\Rightarrow 2x=3\]
Divide the whole expression by 2. We get
\[\Rightarrow \dfrac{2x}{2}=\dfrac{3}{2}\]
Cancelling out the common term 2 from the LHS, we get
\[x=\dfrac{3}{2}\]
Therefore, the x-intercept is \[\dfrac{3}{2}\] and the point is \[\left( \dfrac{3}{2},0 \right)\].
Now, we have to find the y-intercept.
Substitute x=0. We get,
y+0=3
Therefore, y=3.
Hence, the y-intercept is 3 and the point is (0,3).
Plot the points \[\left( \dfrac{3}{2},0 \right)\] and (0,3) in the graph.
Join the two points with a straight line.
We get
Therefore, the value of y in y+2x=3 is 3-2x and the graph of y+2x=3 is obtained.
Note: We should simply draw straight lines between the two points. Since the given equation is a linear equation, the graph will always be a straight line. It is enough to just find the x and y intercepts and plot a graph with those points. Avoid calculation mistakes based on finding the values of the intercepts.
Recently Updated Pages
Master Class 5 English: Engaging Questions & Answers for Success
Master Class 5 Maths: Engaging Questions & Answers for Success
Master Class 5 Social Science: Engaging Questions & Answers for Success
Master Class 5 Science: Engaging Questions & Answers for Success
Class 5 Question and Answer - Your Ultimate Solutions Guide
Master Class 9 General Knowledge: Engaging Questions & Answers for Success
Trending doubts
Explain the Treaty of Vienna of 1815 class 10 social science CBSE
What is the Total Duration of Football Match?
The shortest day of the year in India
In which year voting age was reduced from 21 to 18?
10 examples of evaporation in daily life with explanations
What planets have no moons Which one has only one moon class 10 physics CBSE