


Solve and graph the inequalities $ x < 5 $ or $ x > - 1 $ .
Answer
567.3k+ views
Hint: Inequality is used to compare two numbers on the number line by their sizes. It is a relation through which we can make a non-equal comparison between two numbers or other mathematical expressions. In this problem, we have to solve and graph the inequalities given.
Complete step-by-step answer:
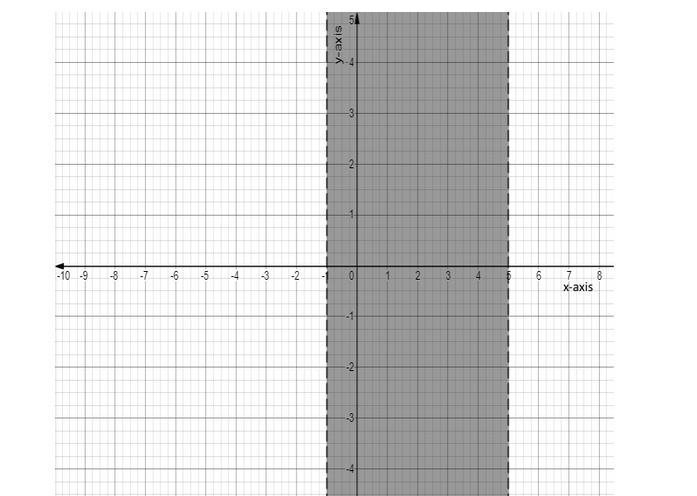
n order to solve the inequalities or $ x > - 1 $ , we can examine that in these inequalities x is smaller than $ 5 $ and x is greater than $ - 1 $ and on combining these two inequalities we can also say that, x is smaller than $ 5 $ and is greater than $ - 1 $ , now, we can write the expression as,
$ 5 > x > - 1 $ or we can also write it as $ - 1 < x < 5 $ . Now, we have to graph the inequality, from the expression we can say that x lie between $ - 1 $ and $ 5 $ and the graph of the inequality becomes,
Note: Mainly, there are two comparison symbols, one is of greater than $ \left( > \right) $ and other one is of smaller than $ \left( < \right) $ and there are other two comparison symbols as well, it is greater than or equal to $ \left( \geqslant \right) $ and smaller than or equal to $ \left( \leqslant \right) $ . For example, we have to make a graph of the inequality like $ - 10 \leqslant x < 10 $ , where one is symbol of smaller than or equal to and one is a symbol of smaller than and this expression can also be written as $ 10 > x \geqslant - 10 $ , here one is a symbol of greater than and other one is of greater than or equal to. Now, to make the graph for these inequalities, we will use filled dot and unfilled dot on the graph, where the filled dot represents that the number is greater/smaller than or equal to and unfilled dot represents that the number is greater or smaller than but not equal to.
Complete step-by-step answer:
n order to solve the inequalities or $ x > - 1 $ , we can examine that in these inequalities x is smaller than $ 5 $ and x is greater than $ - 1 $ and on combining these two inequalities we can also say that, x is smaller than $ 5 $ and is greater than $ - 1 $ , now, we can write the expression as,
$ 5 > x > - 1 $ or we can also write it as $ - 1 < x < 5 $ . Now, we have to graph the inequality, from the expression we can say that x lie between $ - 1 $ and $ 5 $ and the graph of the inequality becomes,
Note: Mainly, there are two comparison symbols, one is of greater than $ \left( > \right) $ and other one is of smaller than $ \left( < \right) $ and there are other two comparison symbols as well, it is greater than or equal to $ \left( \geqslant \right) $ and smaller than or equal to $ \left( \leqslant \right) $ . For example, we have to make a graph of the inequality like $ - 10 \leqslant x < 10 $ , where one is symbol of smaller than or equal to and one is a symbol of smaller than and this expression can also be written as $ 10 > x \geqslant - 10 $ , here one is a symbol of greater than and other one is of greater than or equal to. Now, to make the graph for these inequalities, we will use filled dot and unfilled dot on the graph, where the filled dot represents that the number is greater/smaller than or equal to and unfilled dot represents that the number is greater or smaller than but not equal to.

Recently Updated Pages
Master Class 12 Business Studies: Engaging Questions & Answers for Success
Master Class 12 Biology: Engaging Questions & Answers for Success
Master Class 12 Chemistry: Engaging Questions & Answers for Success
Class 12 Question and Answer - Your Ultimate Solutions Guide
Master Class 11 Social Science: Engaging Questions & Answers for Success
Master Class 11 English: Engaging Questions & Answers for Success
Trending doubts
What is BLO What is the full form of BLO class 8 social science CBSE
Citizens of India can vote at the age of A 18 years class 8 social science CBSE
Right to vote is a AFundamental Right BFundamental class 8 social science CBSE
10 slogans on organ donation class 8 english CBSE
Name the states through which the Tropic of Cancer class 8 social science CBSE
What are the 12 elements of nature class 8 chemistry CBSE