




How do you solve and graph \[3x \geqslant 15\] ?
Answer
 Verified
610.5k+ views
Hint:Here in this question, we have to plot a graph. Usually while plotting the graph, we plot x axis versus y- axis. But here in this question we have only one variable and we have greater than and less than inequality. For this variable we have to plot the graph. Hence, we get a line. We cannot specify a particular point.
Complete step by step explanation:
The graph is generally plotted x- axis versus y -axis. When we have two variables then we plot a two-dimensional graph. Here in this question, we have only one variable but this is also a two-dimensional graph. Here y is not mentioned. Here in this question we have one inequality. First we simplify the given inequality and we plot the graph for the inequality.
Consider the first inequality
\[3x \geqslant 15\]
Divide the above equation by 3
\[ \Rightarrow x \geqslant 5\]
For any value of y either it is positive terms or the negative terms the value of x will range greater than or equal to 5.
The graph for the given equation \[3x \geqslant 15\] is as shown below.
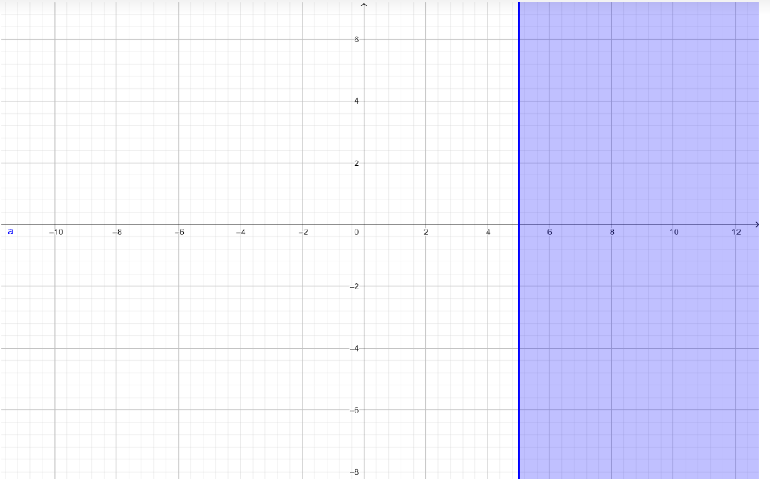
If we see the graph the region is parallel to the y-axis and it does not have a specified line.
We don’t have a one dimensional graph, if the equation contains only one variable either its x or y we must know that for any value x or y the equation will be constant.
Note: The graph is plotted against the two axes namely X-axis and Y-axis. If we know the value of one, we can find the other by using the equation of the graph. This graph is two dimensional because they have mentioned only two axes. The value of y can range, it does not have a particular value. Because the inequality has greater than and less than symbols.
Complete step by step explanation:
The graph is generally plotted x- axis versus y -axis. When we have two variables then we plot a two-dimensional graph. Here in this question, we have only one variable but this is also a two-dimensional graph. Here y is not mentioned. Here in this question we have one inequality. First we simplify the given inequality and we plot the graph for the inequality.
Consider the first inequality
\[3x \geqslant 15\]
Divide the above equation by 3
\[ \Rightarrow x \geqslant 5\]
For any value of y either it is positive terms or the negative terms the value of x will range greater than or equal to 5.
The graph for the given equation \[3x \geqslant 15\] is as shown below.
If we see the graph the region is parallel to the y-axis and it does not have a specified line.
We don’t have a one dimensional graph, if the equation contains only one variable either its x or y we must know that for any value x or y the equation will be constant.
Note: The graph is plotted against the two axes namely X-axis and Y-axis. If we know the value of one, we can find the other by using the equation of the graph. This graph is two dimensional because they have mentioned only two axes. The value of y can range, it does not have a particular value. Because the inequality has greater than and less than symbols.
Recently Updated Pages
Class 10 Question and Answer - Your Ultimate Solutions Guide

Master Class 10 Computer Science: Engaging Questions & Answers for Success
Master Class 10 General Knowledge: Engaging Questions & Answers for Success
Master Class 12 Economics: Engaging Questions & Answers for Success
Master Class 12 Social Science: Engaging Questions & Answers for Success
Master Class 12 English: Engaging Questions & Answers for Success
Trending doubts
The slogan Jai Hind was given by A Lal Bahadur Shastri class 10 social science CBSE
Identify the feminine form of noun nephew a shenephew class 10 english CBSE
CSIR full form?
Make a sketch of the human nerve cell What function class 10 biology CBSE
Distinguish between coming together federations and class 10 social science CBSE
State BPT theorem and prove it class 10 maths CBSE